 Comics about mathematics, science, and the student life.
Cramming In

“Just look at these notes that I’ll post three days before the exam but never explain. You’ll get all the ideas there.”
07 Feb 2024Never-Ending Projects
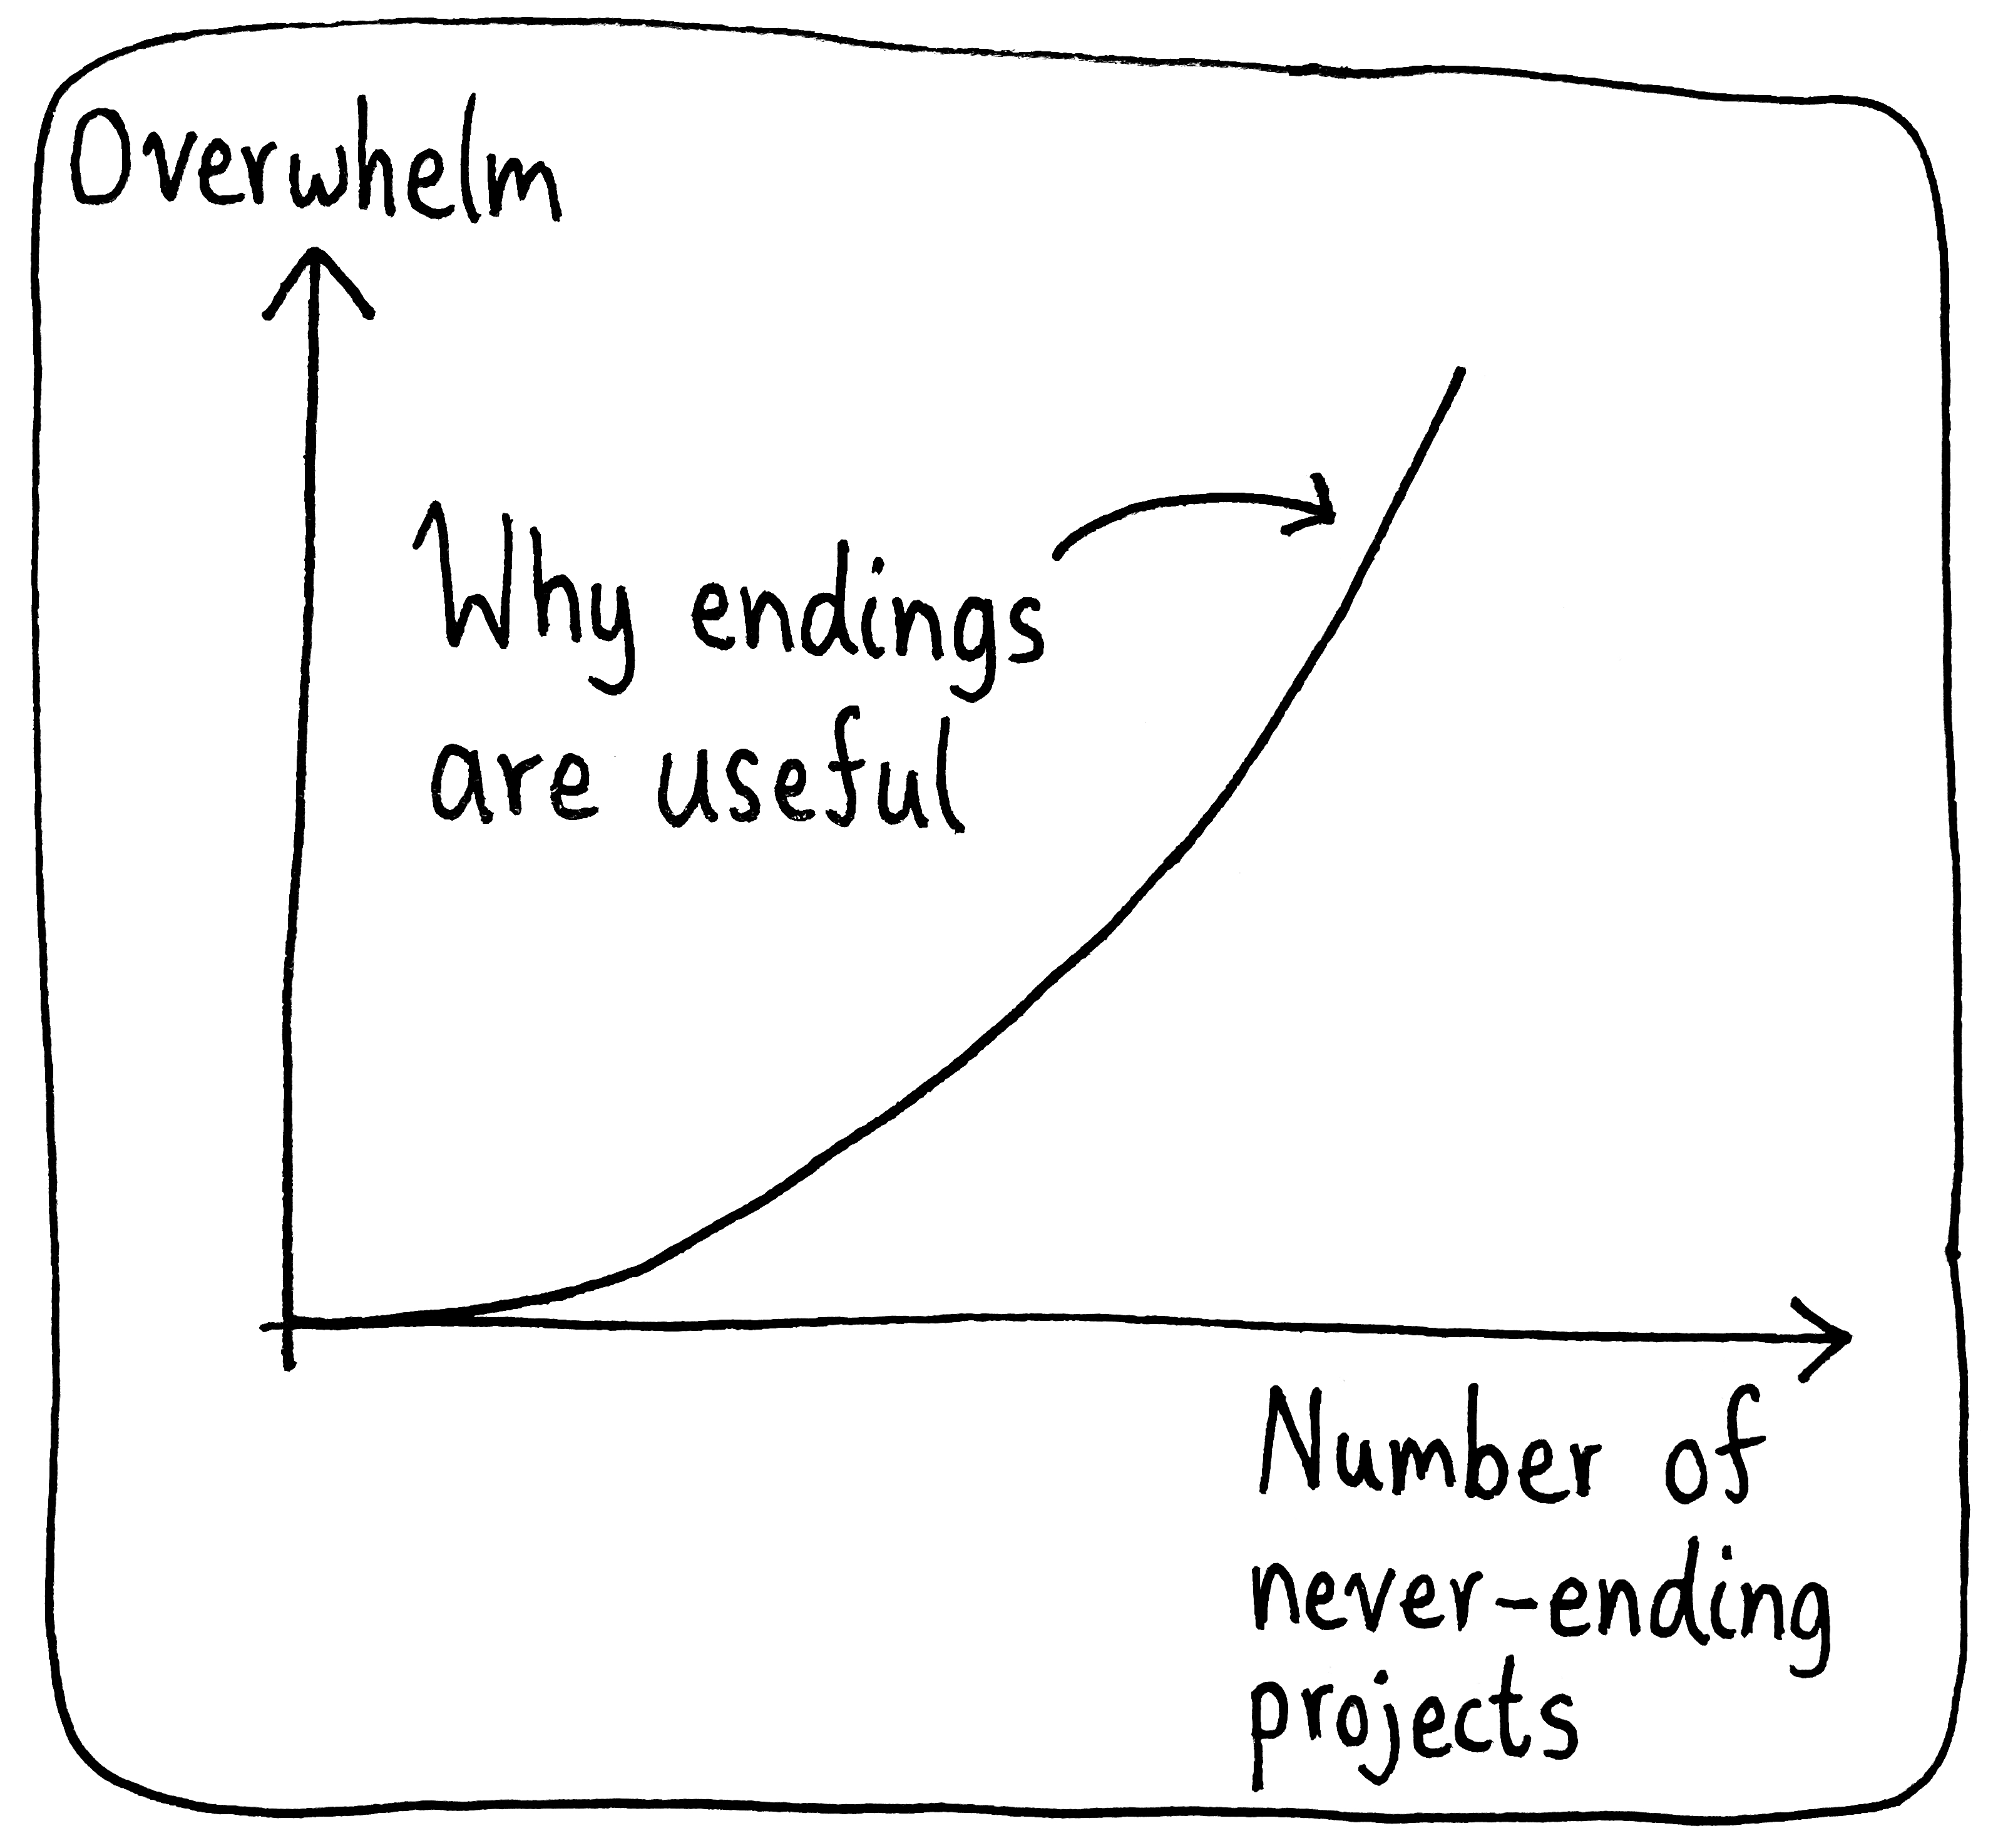
If you’re like me and want to do everything, it’s a lot easier when you don’t require doing each new activity until you die.
31 Jan 2024Ready
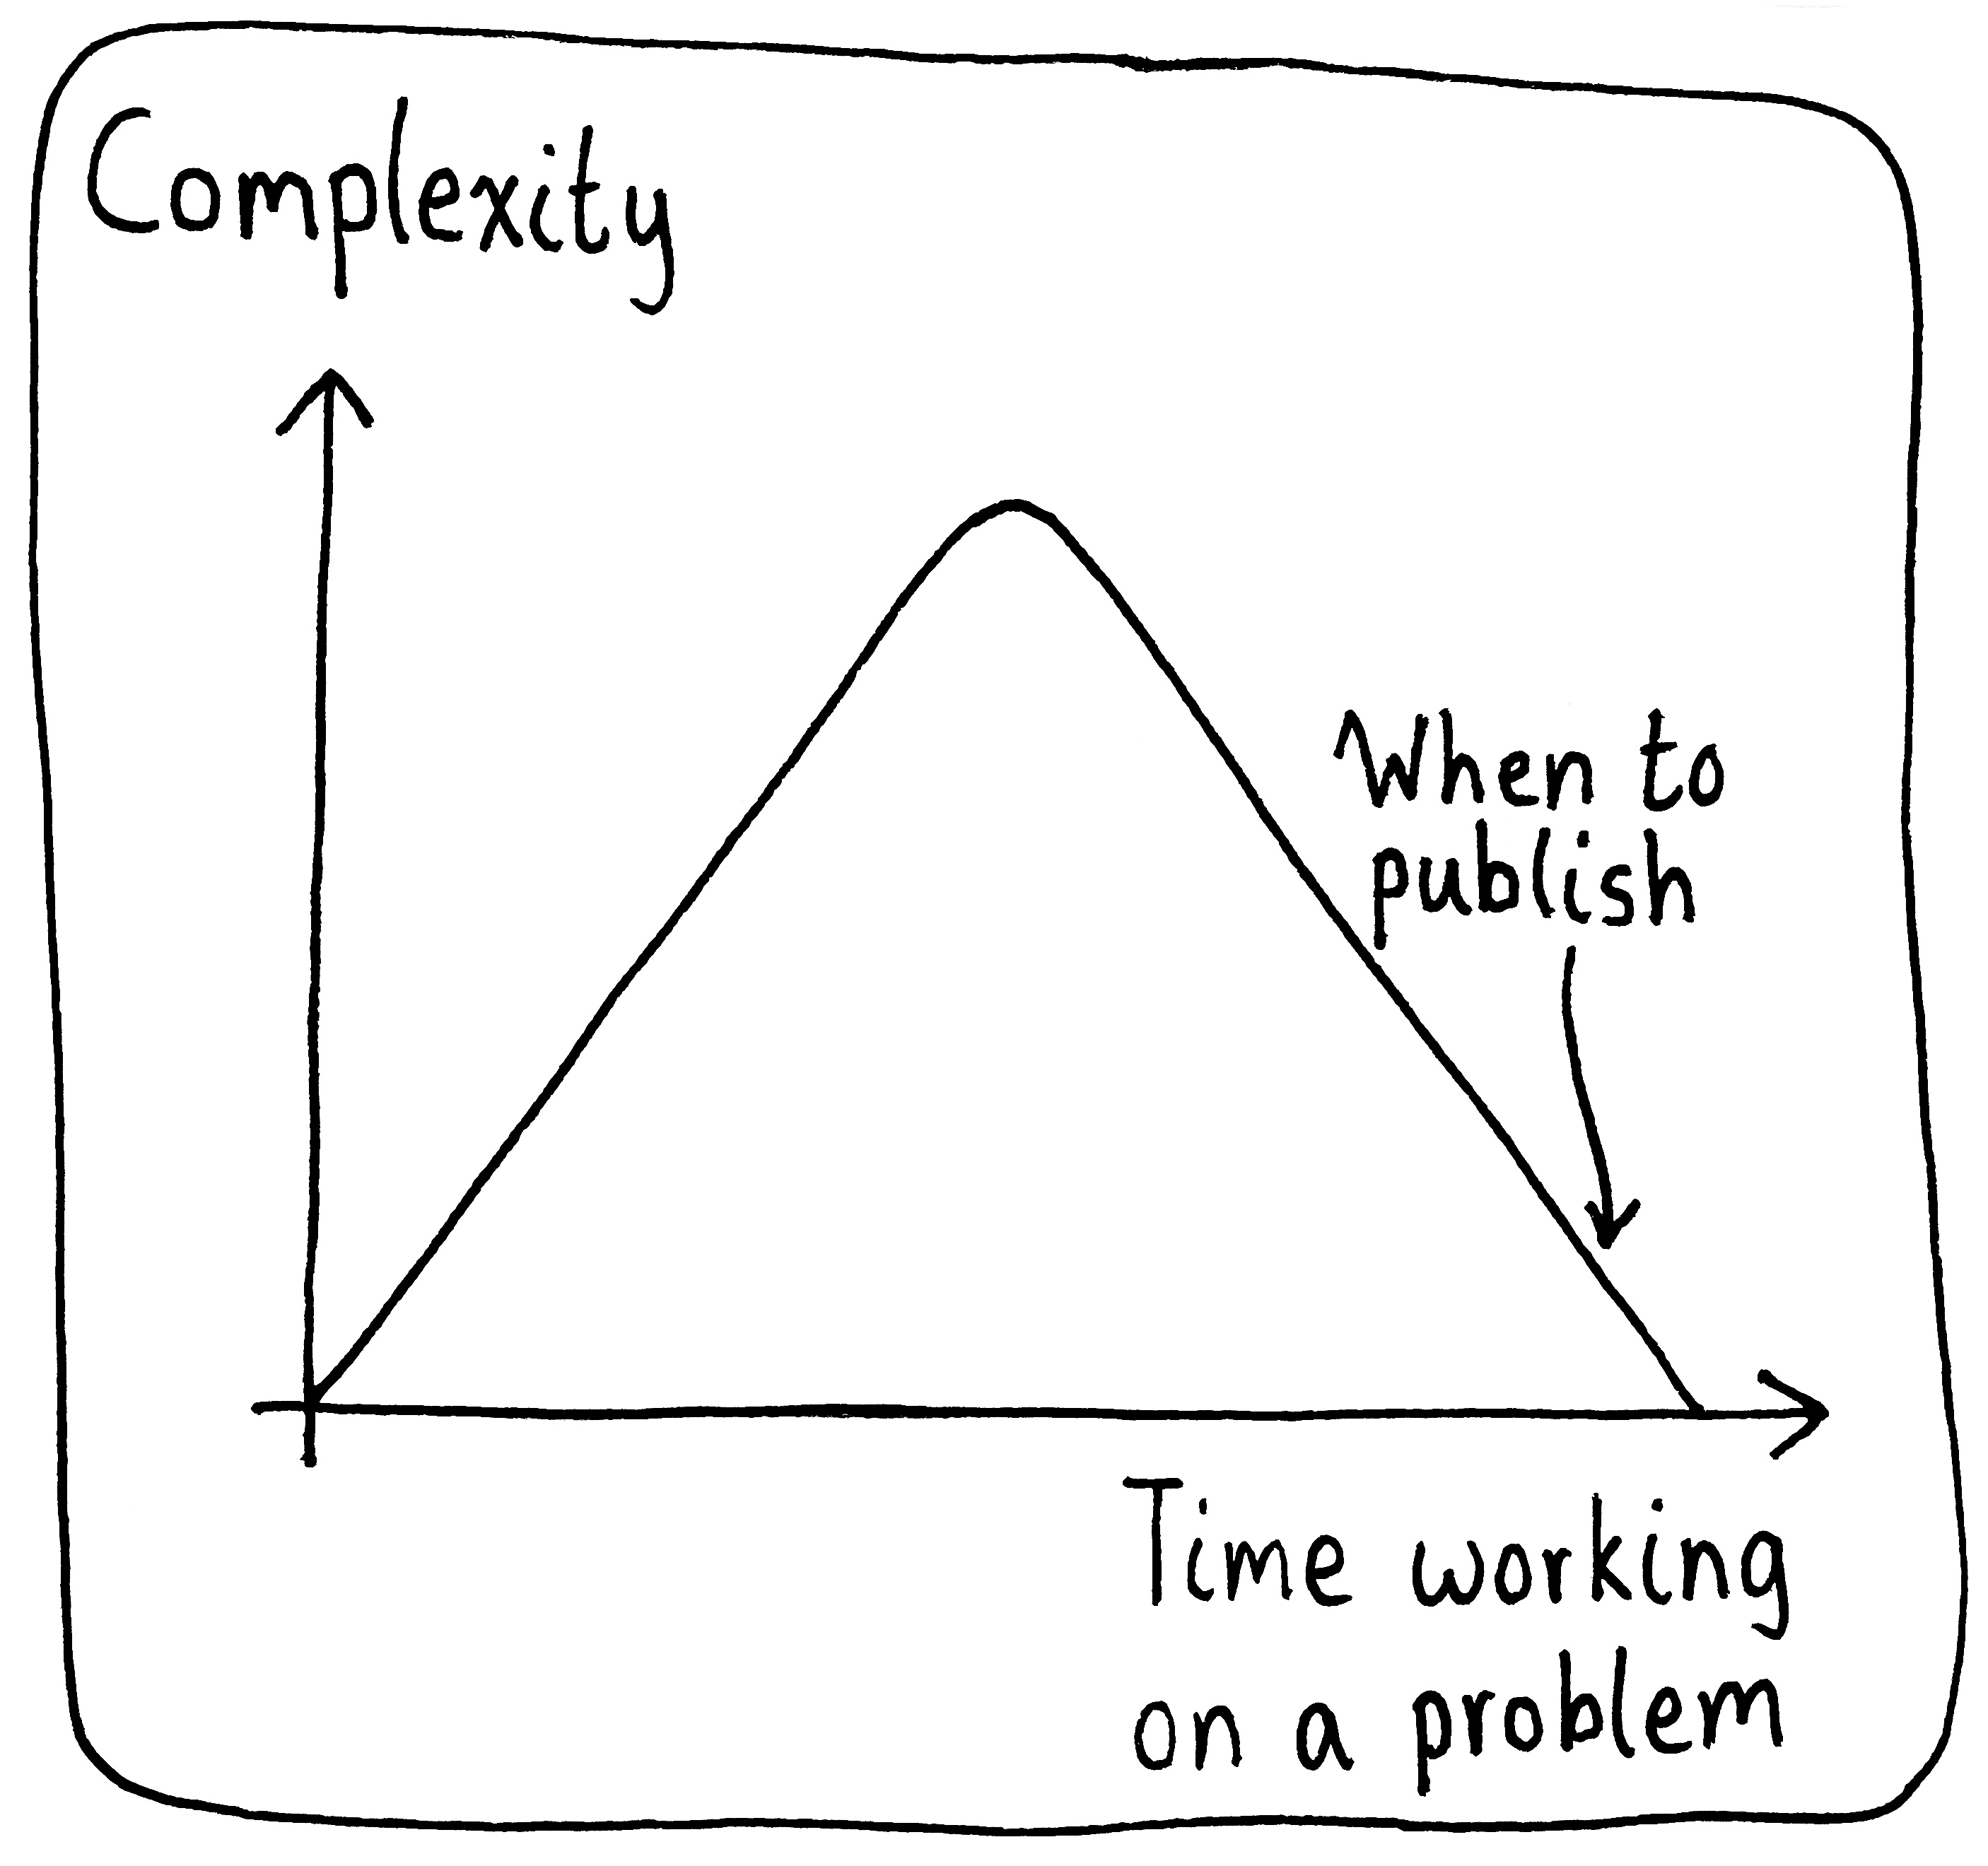
The first half is all about loading everything into your head, while the second is about sorting it.
24 Jan 2024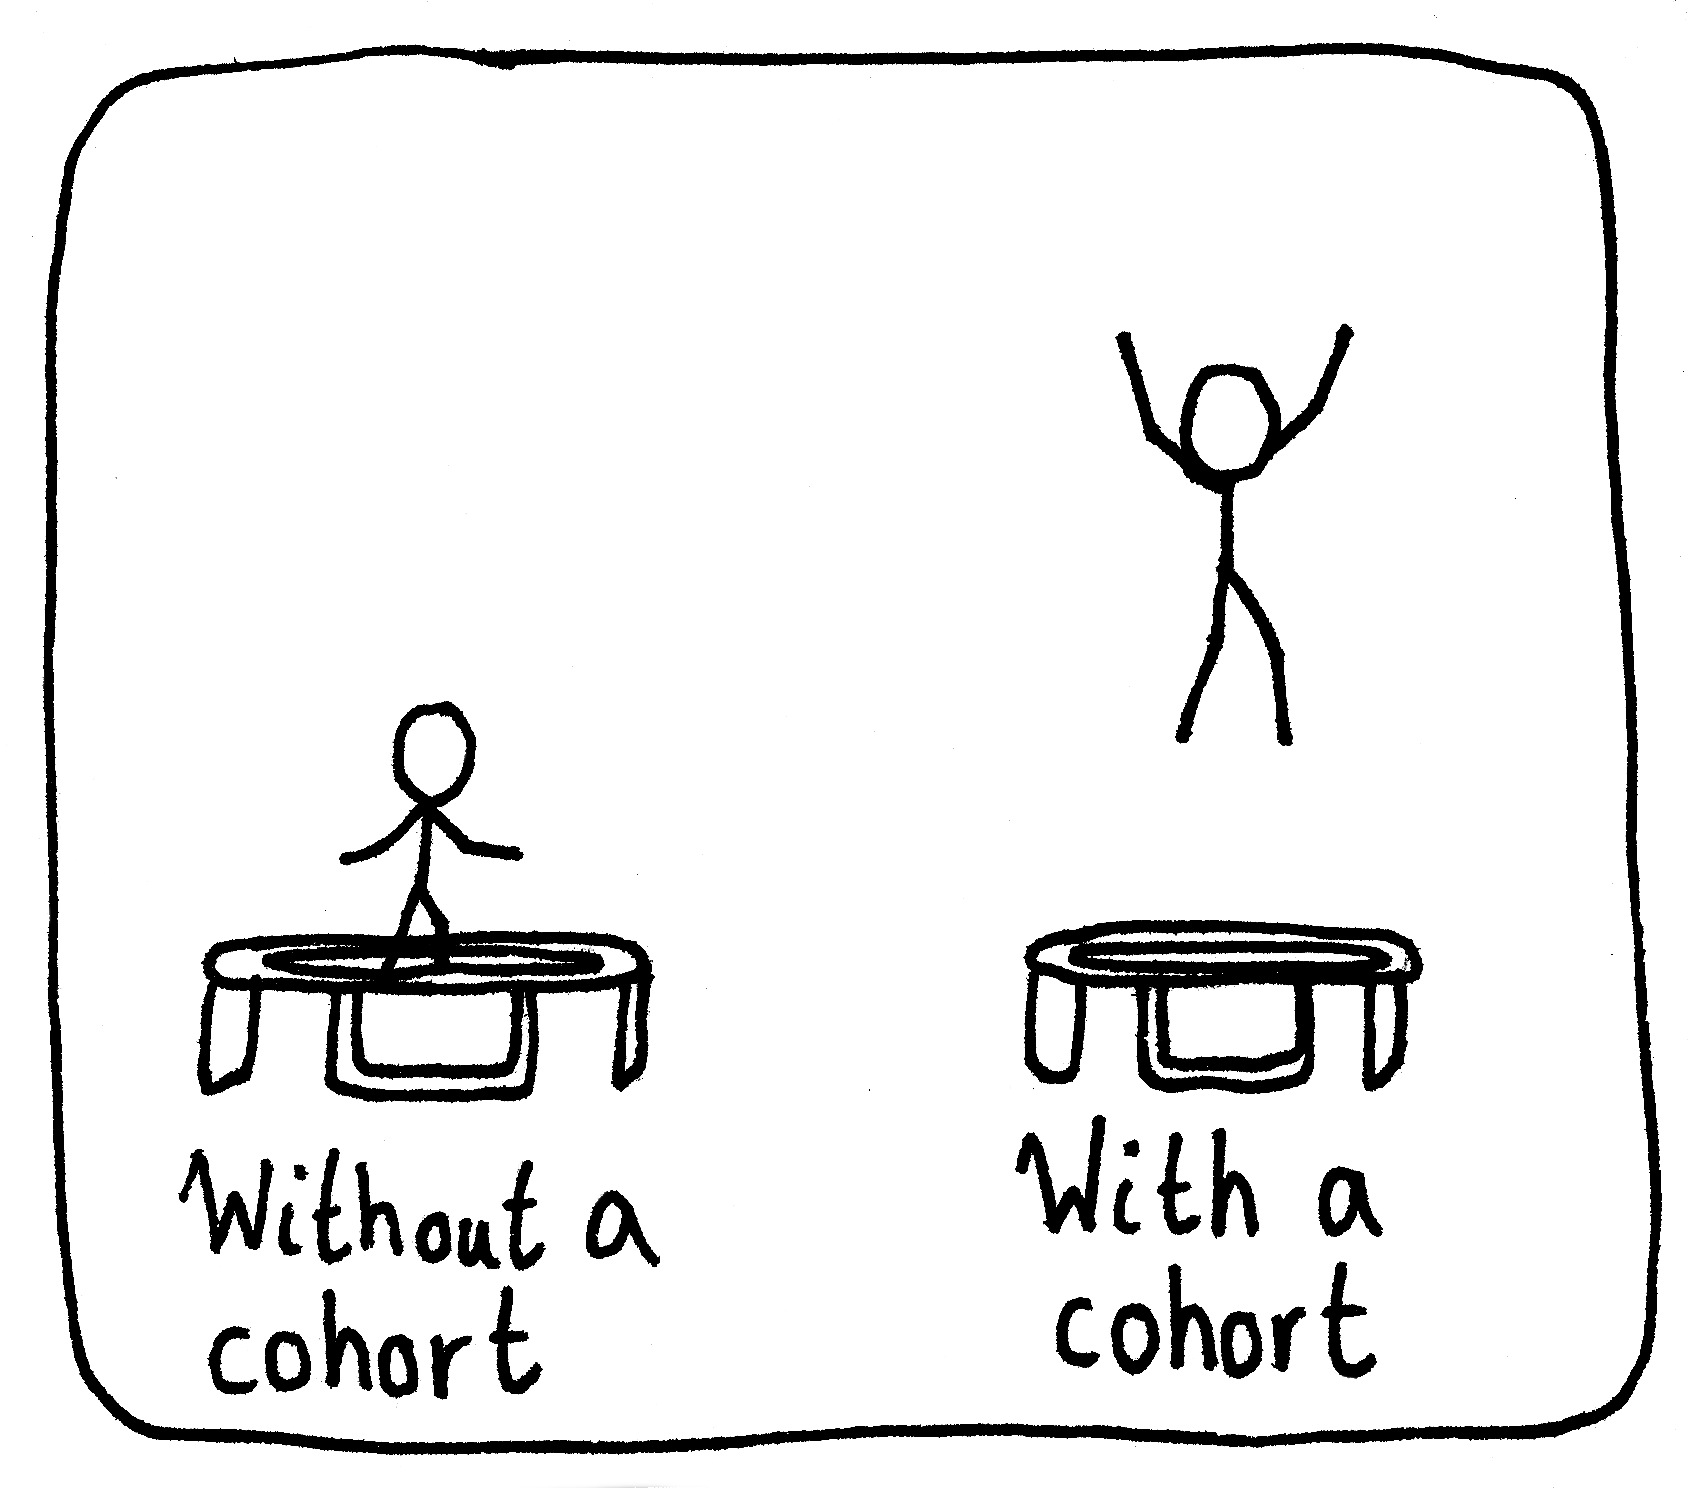
Crackpot Theory

I used to think these emails were just a myth from my supervisors. How wrong I was!
10 Jan 2024Head Start
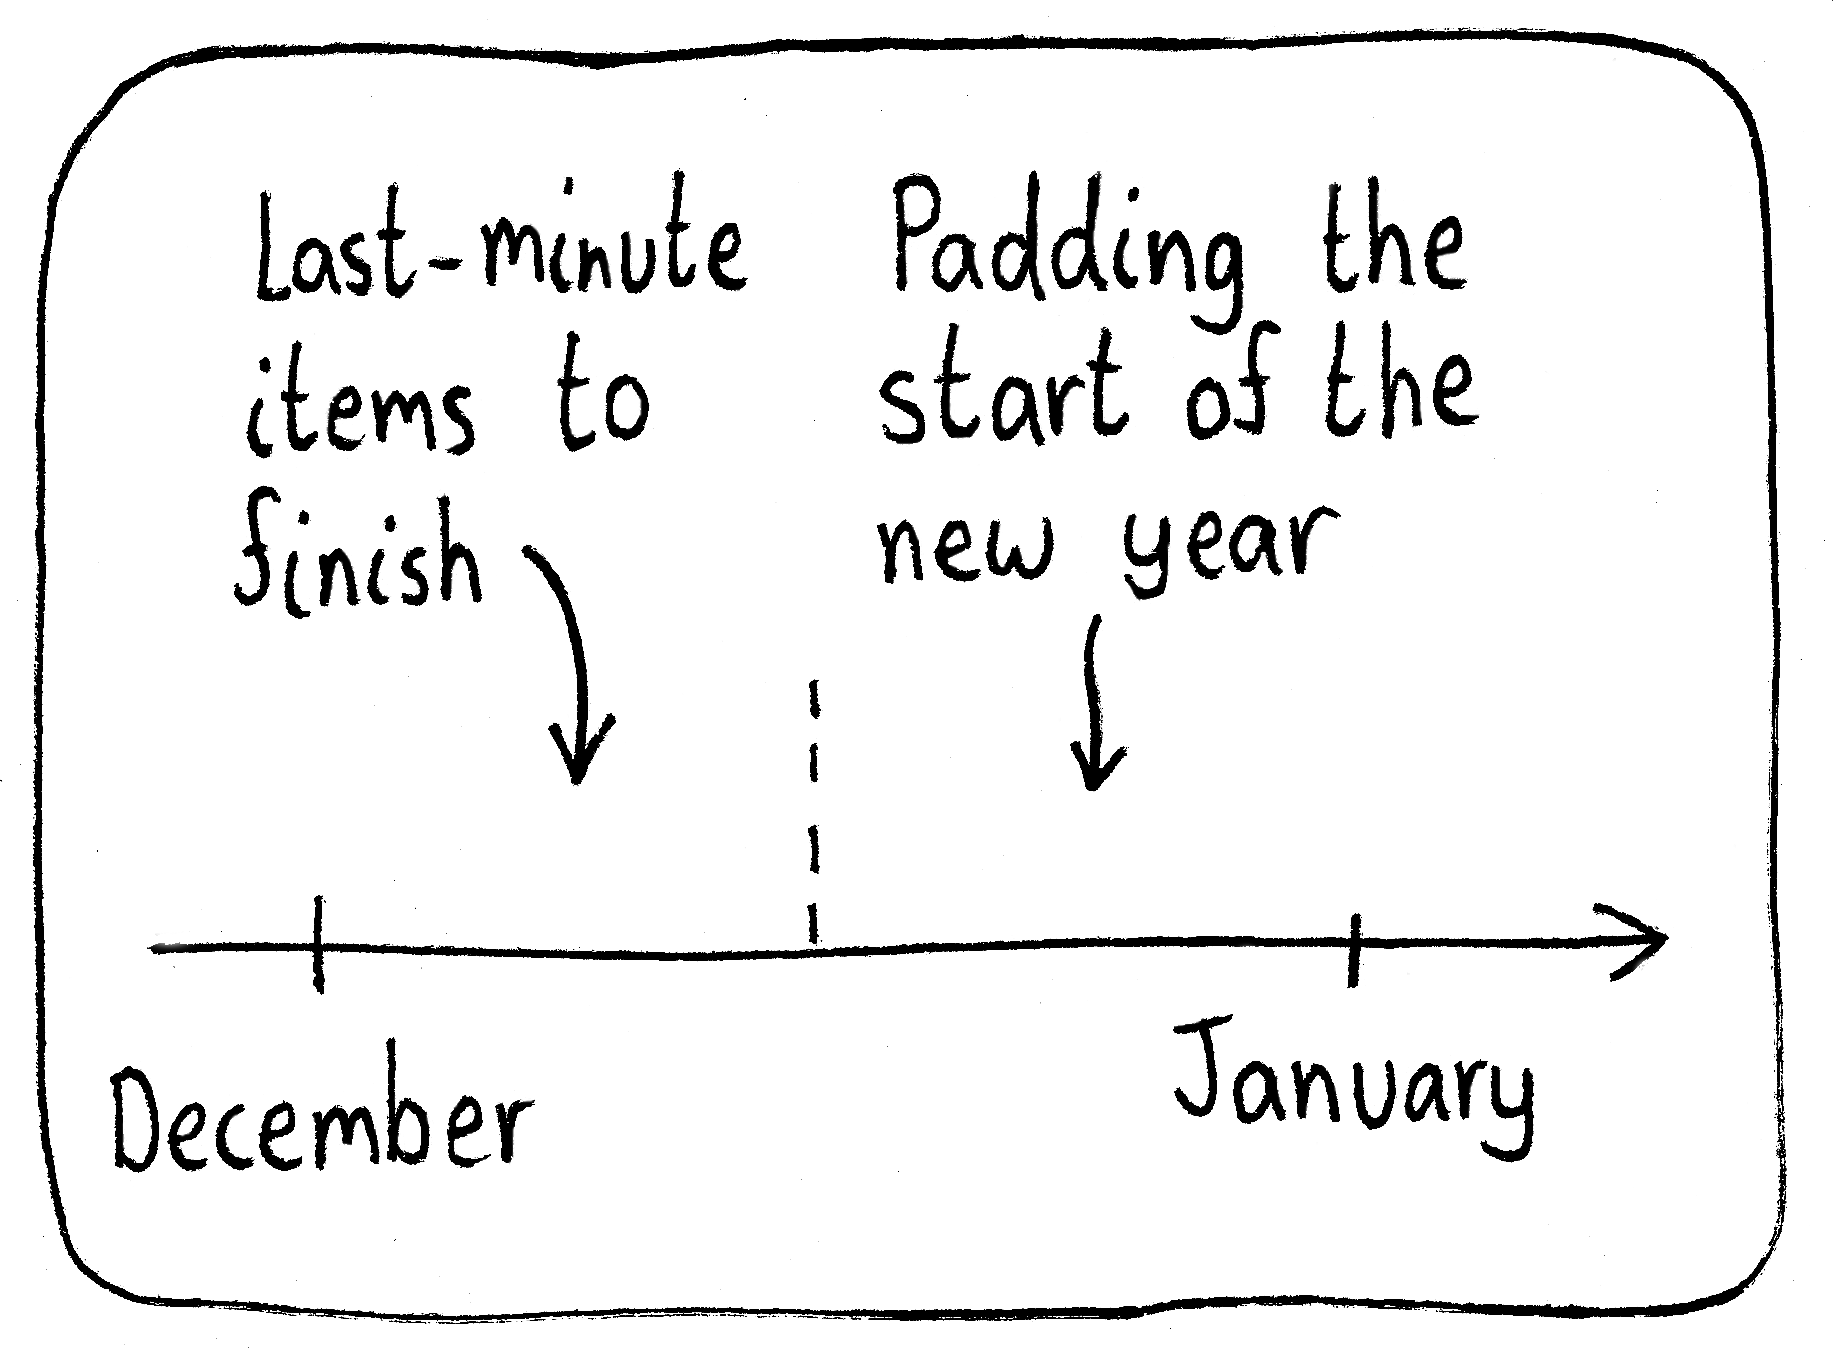
I do this all the time with my reading goals. Do you do this for any area of your life?
01 Jan 2024Santa Supply Chain Efficiency

In the last few years, many of us have come to appreciate the supply chain infrastructure that undergirds much of our world. We notice when it breaks, but not when it gets better. May Santa’s supply chain efficiency gains over time be a shining example of progress during your holidays!
Methodological details: I assumed 34 hours of delivery time (which is roughly in the ballpark from moving between time zones and having a long night), roughly 1/3 of the population being Christian, and children being 0-14 years old. I then took 34 hours and divided by one third of the children population for my estimate over time. You can change the 34 hours figure, but the shape of the curve will stay the same.
25 Dec 2023
Abstraction Tolerance

My abstraction tolerance is proportional to the number of mathematician friends I have who can patiently explain concepts to me.
Hat tip to John Cook’s blog post on the topic.
06 Dec 2023