 Comics about mathematics, science, and the student life.
Drag
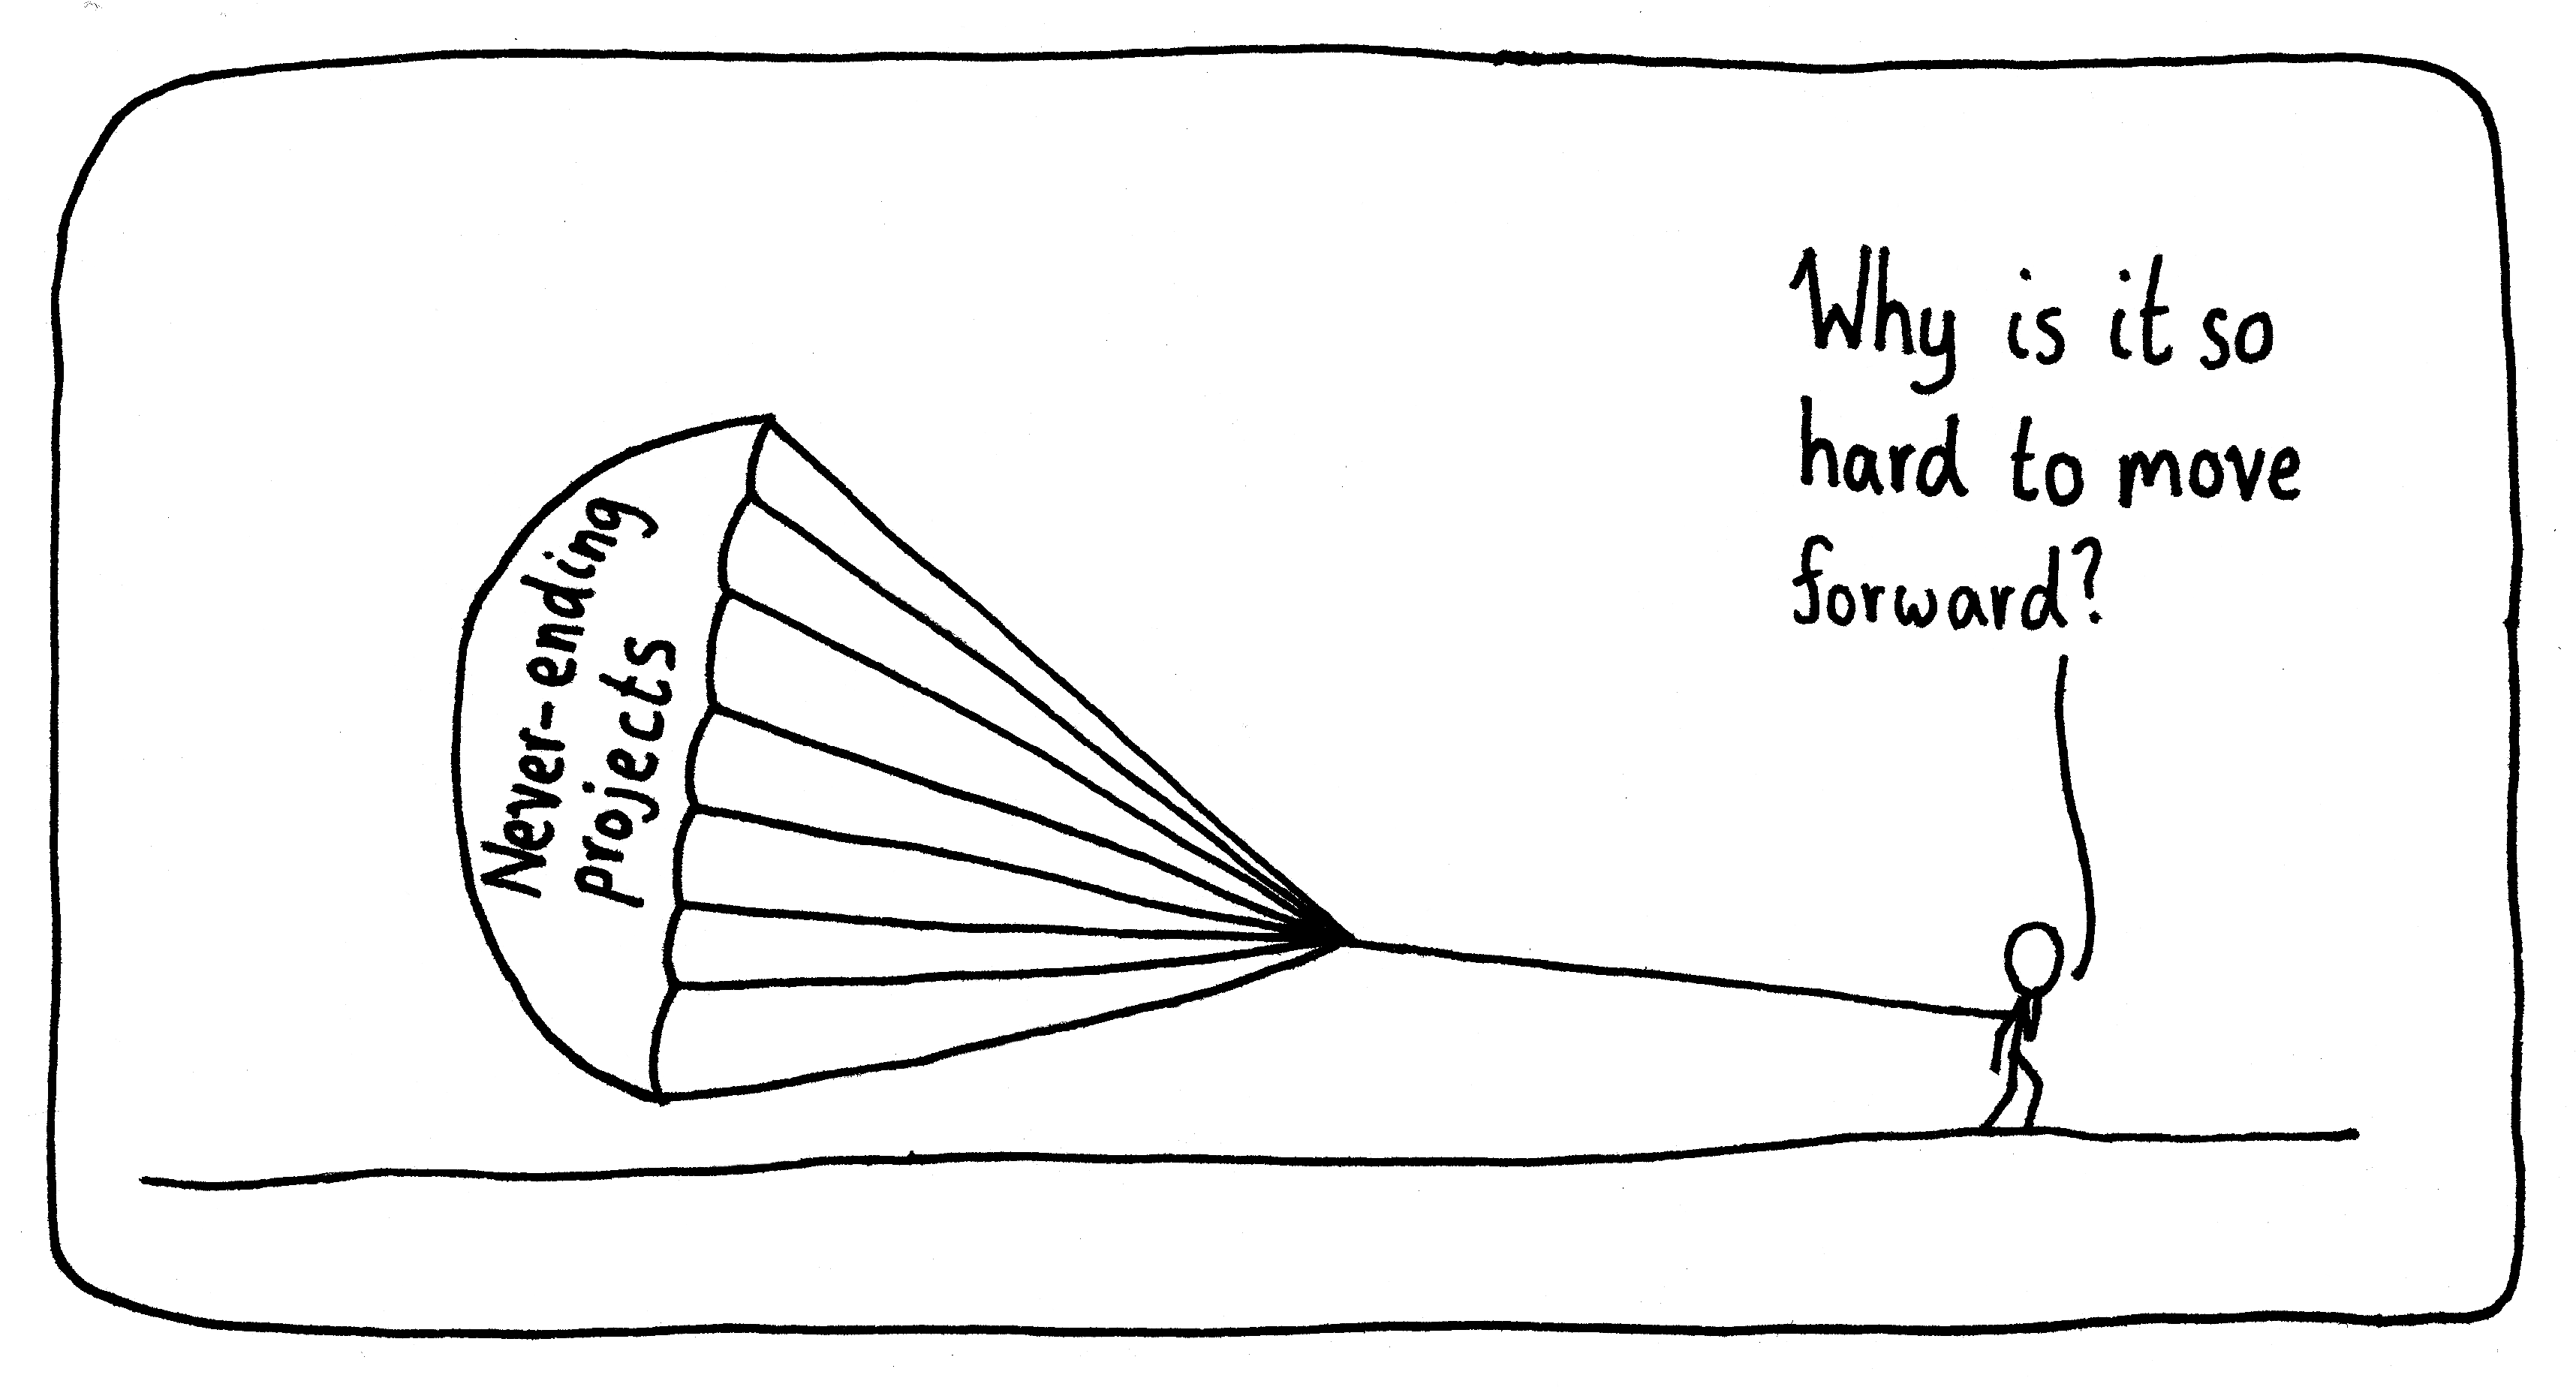
There’s a reason why most projects last for a finite time. (By the way, I’m inspired by Craig Mod’s pop-up newsletters.)
22 Nov 2023
Hard Landing

The friend: “You do realize we passed our destination about twenty minutes ago, right?”
08 Nov 2023

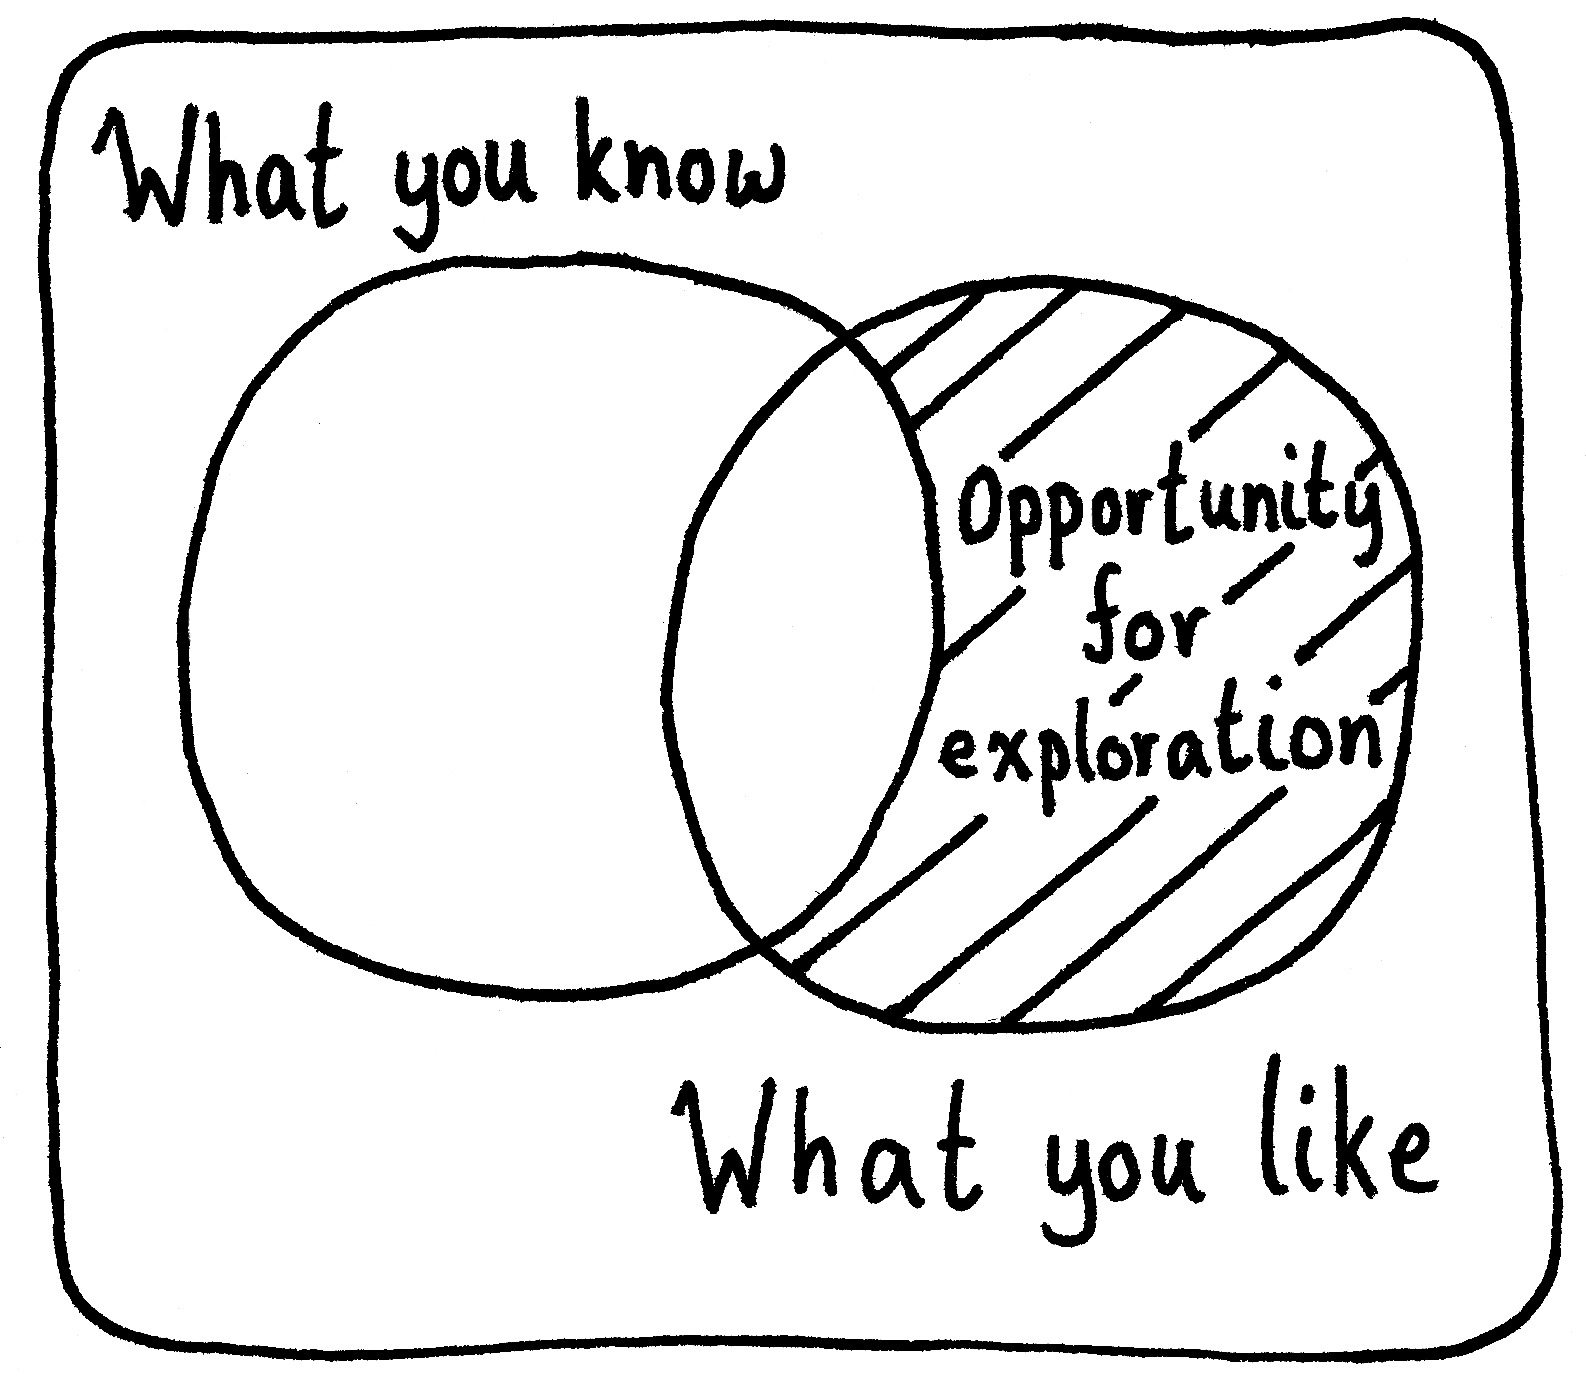
Fact Line

This is the ideal scenario, where scientists are ready to question their assumptions if new evidence emerges. In practice, we probably don’t question as much as we could.
19 Oct 2023Time Hoop

“Maybe I can really stretch it out-?”
“And you’d be one of many that try and fail.”
11 Oct 2023Obstacles

Grad student: “But what about all the obstacles?”
Supervisor: “That’s what you’re here for!”
Hat tip to my research group for inspiring this comic!
04 Oct 2023Decision Jam

“Can’t you just move all the little obligations by to at least process them?”
“Oh no, I have to process this one first!”
27 Sep 2023