 Comics about mathematics, science, and the student life.
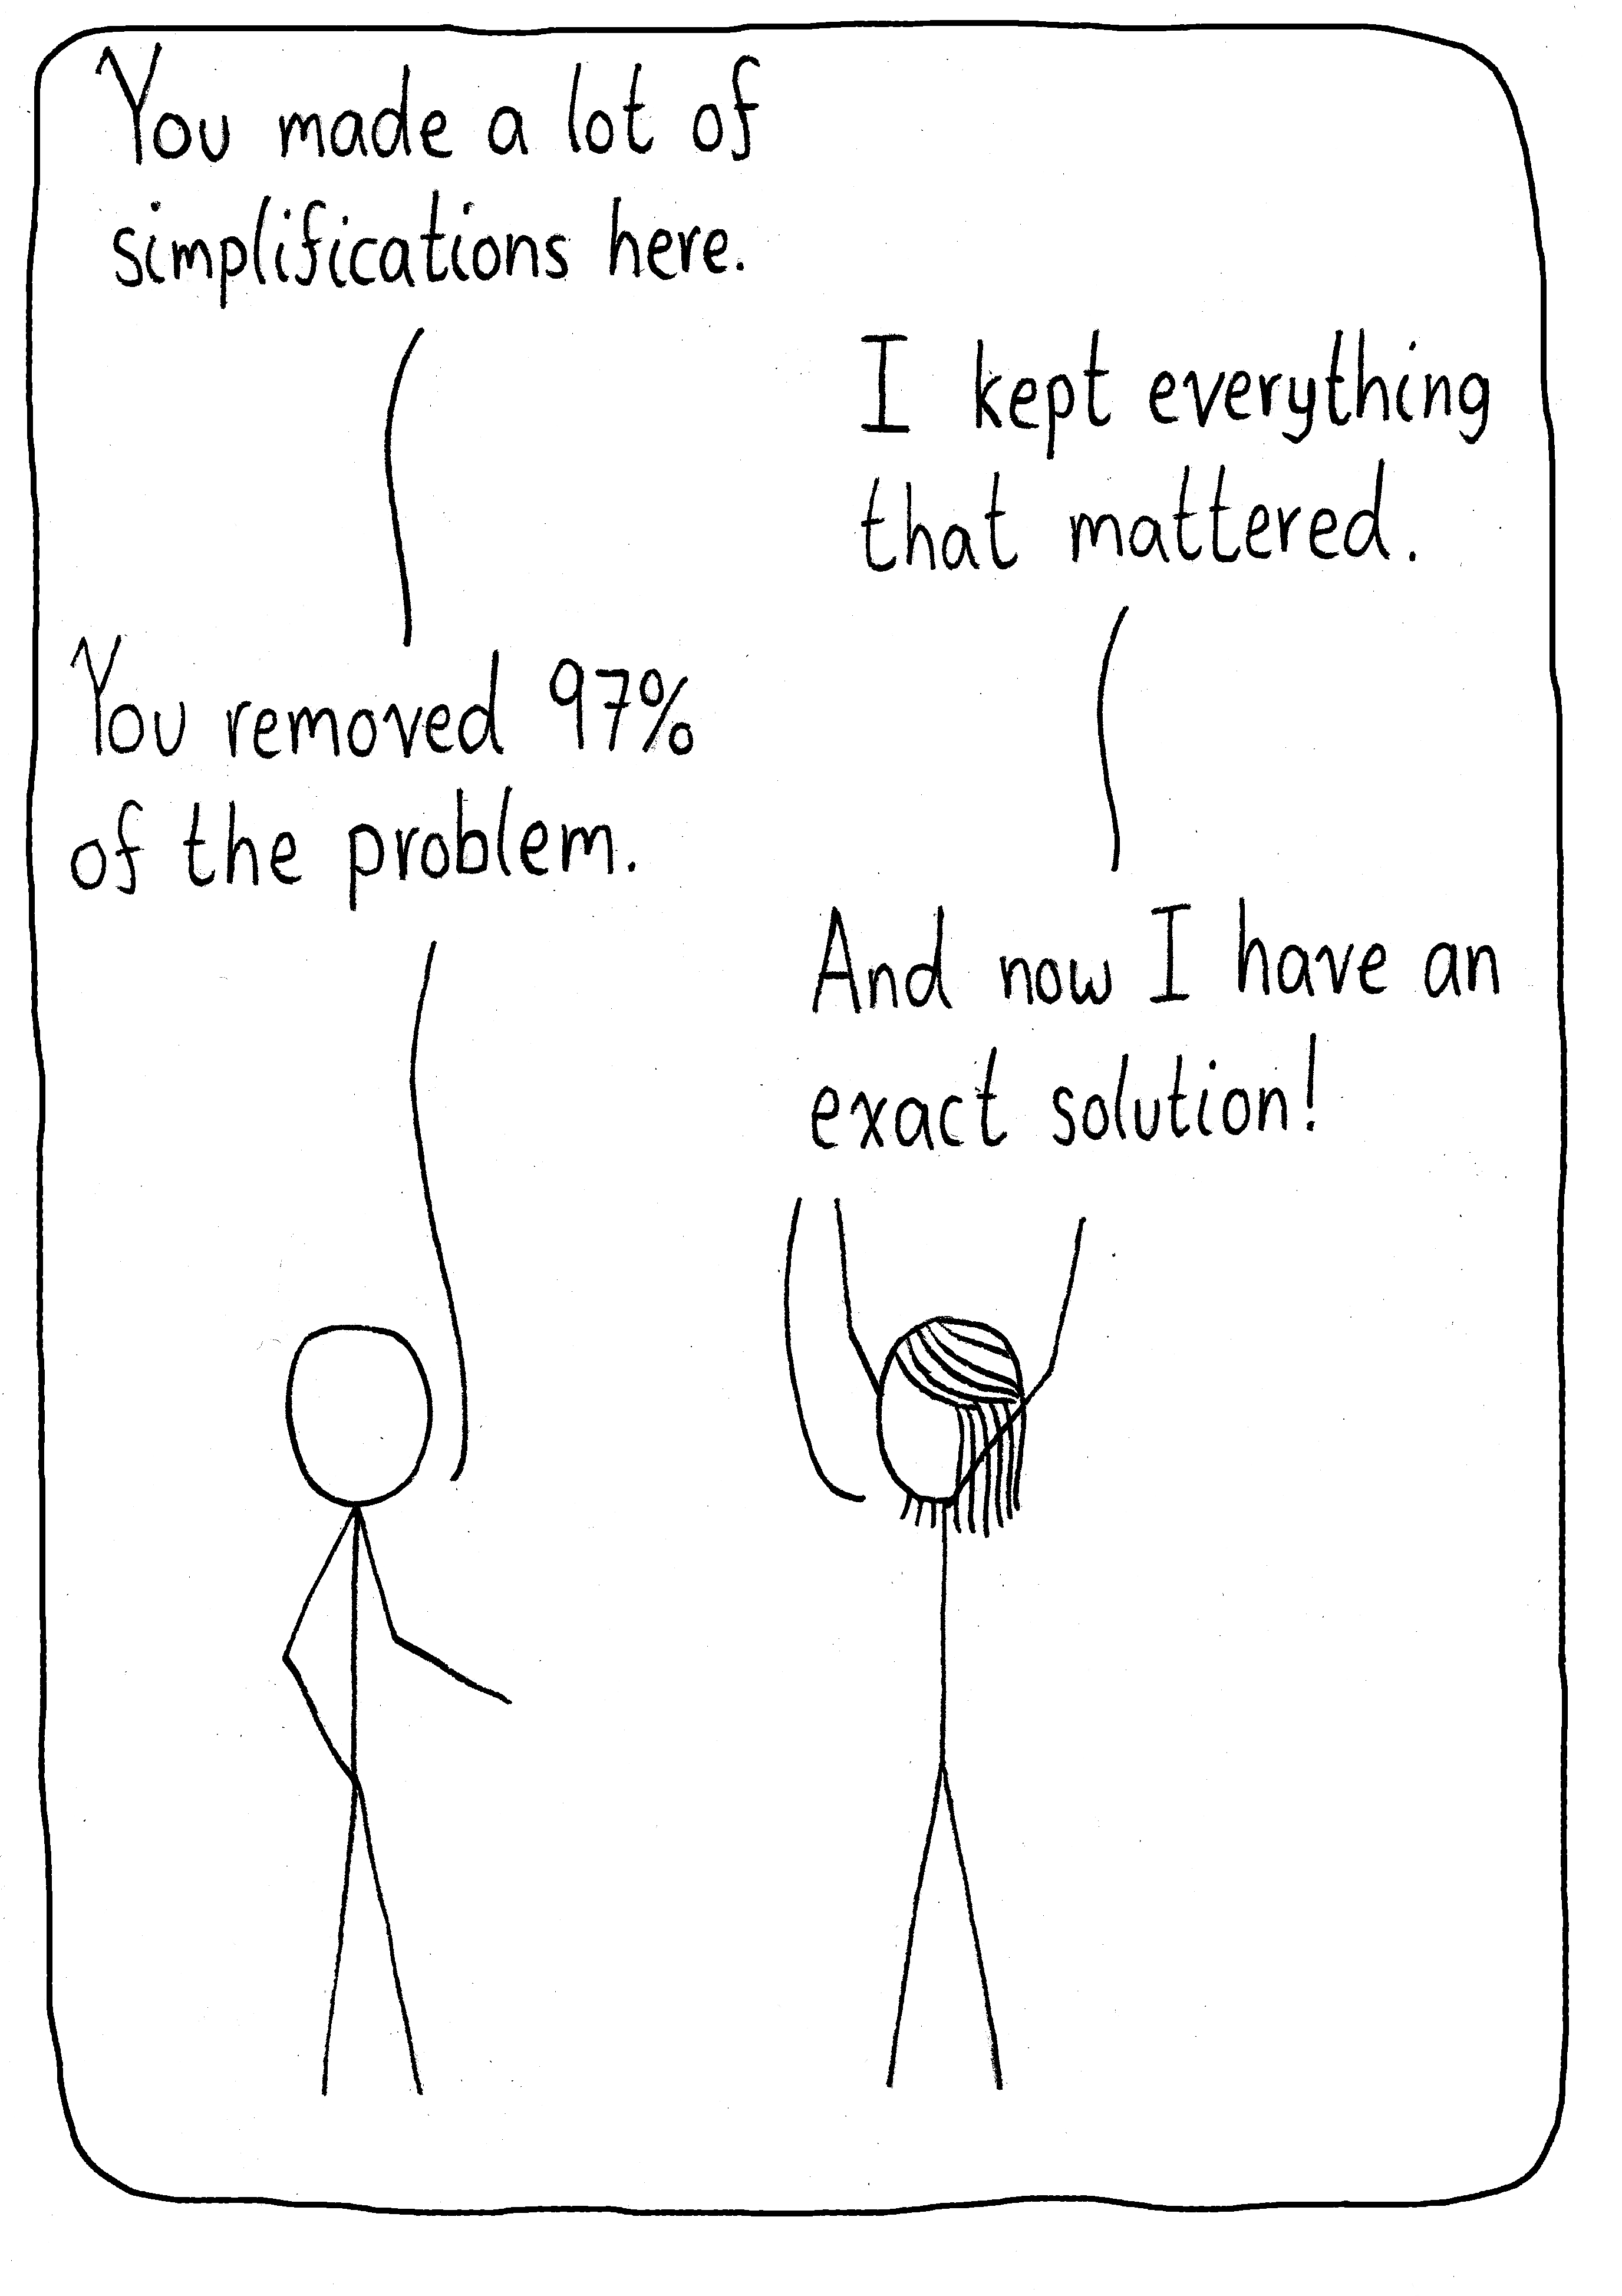
Command Line

I’m sure my running watch picks up a spike in heart rate in these critical moments.
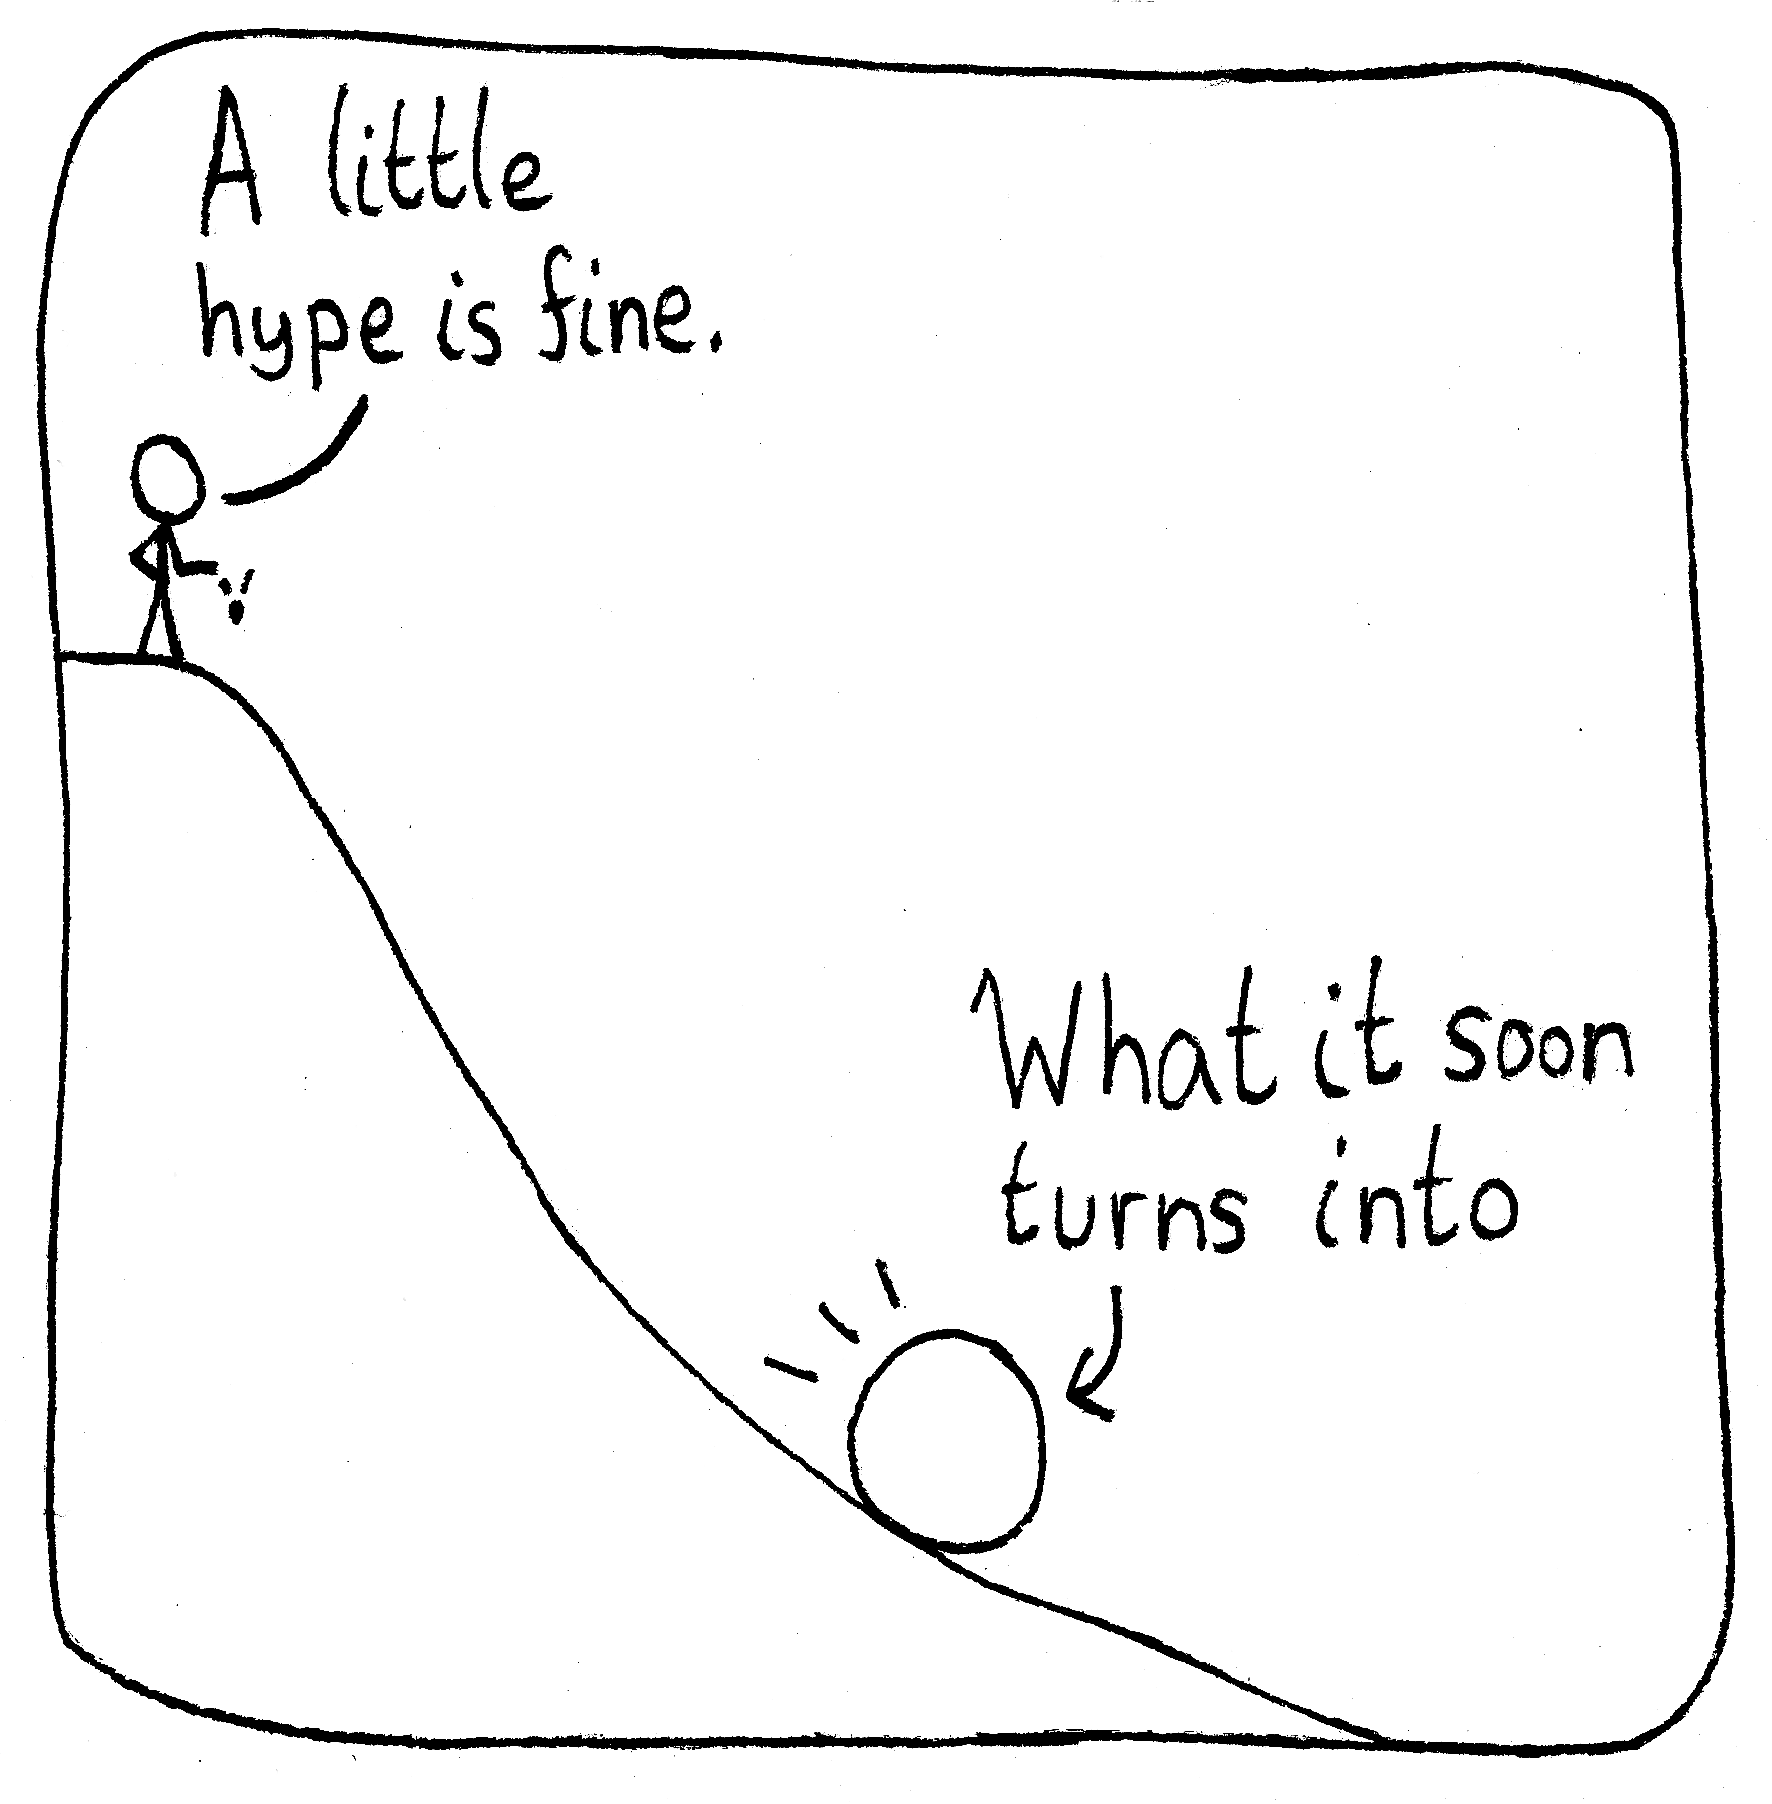
04 Jan 2023Well Written

“The authors had good typographic taste, so I can tell the rest of the paper is good.”
02 Jan 2023Nodding
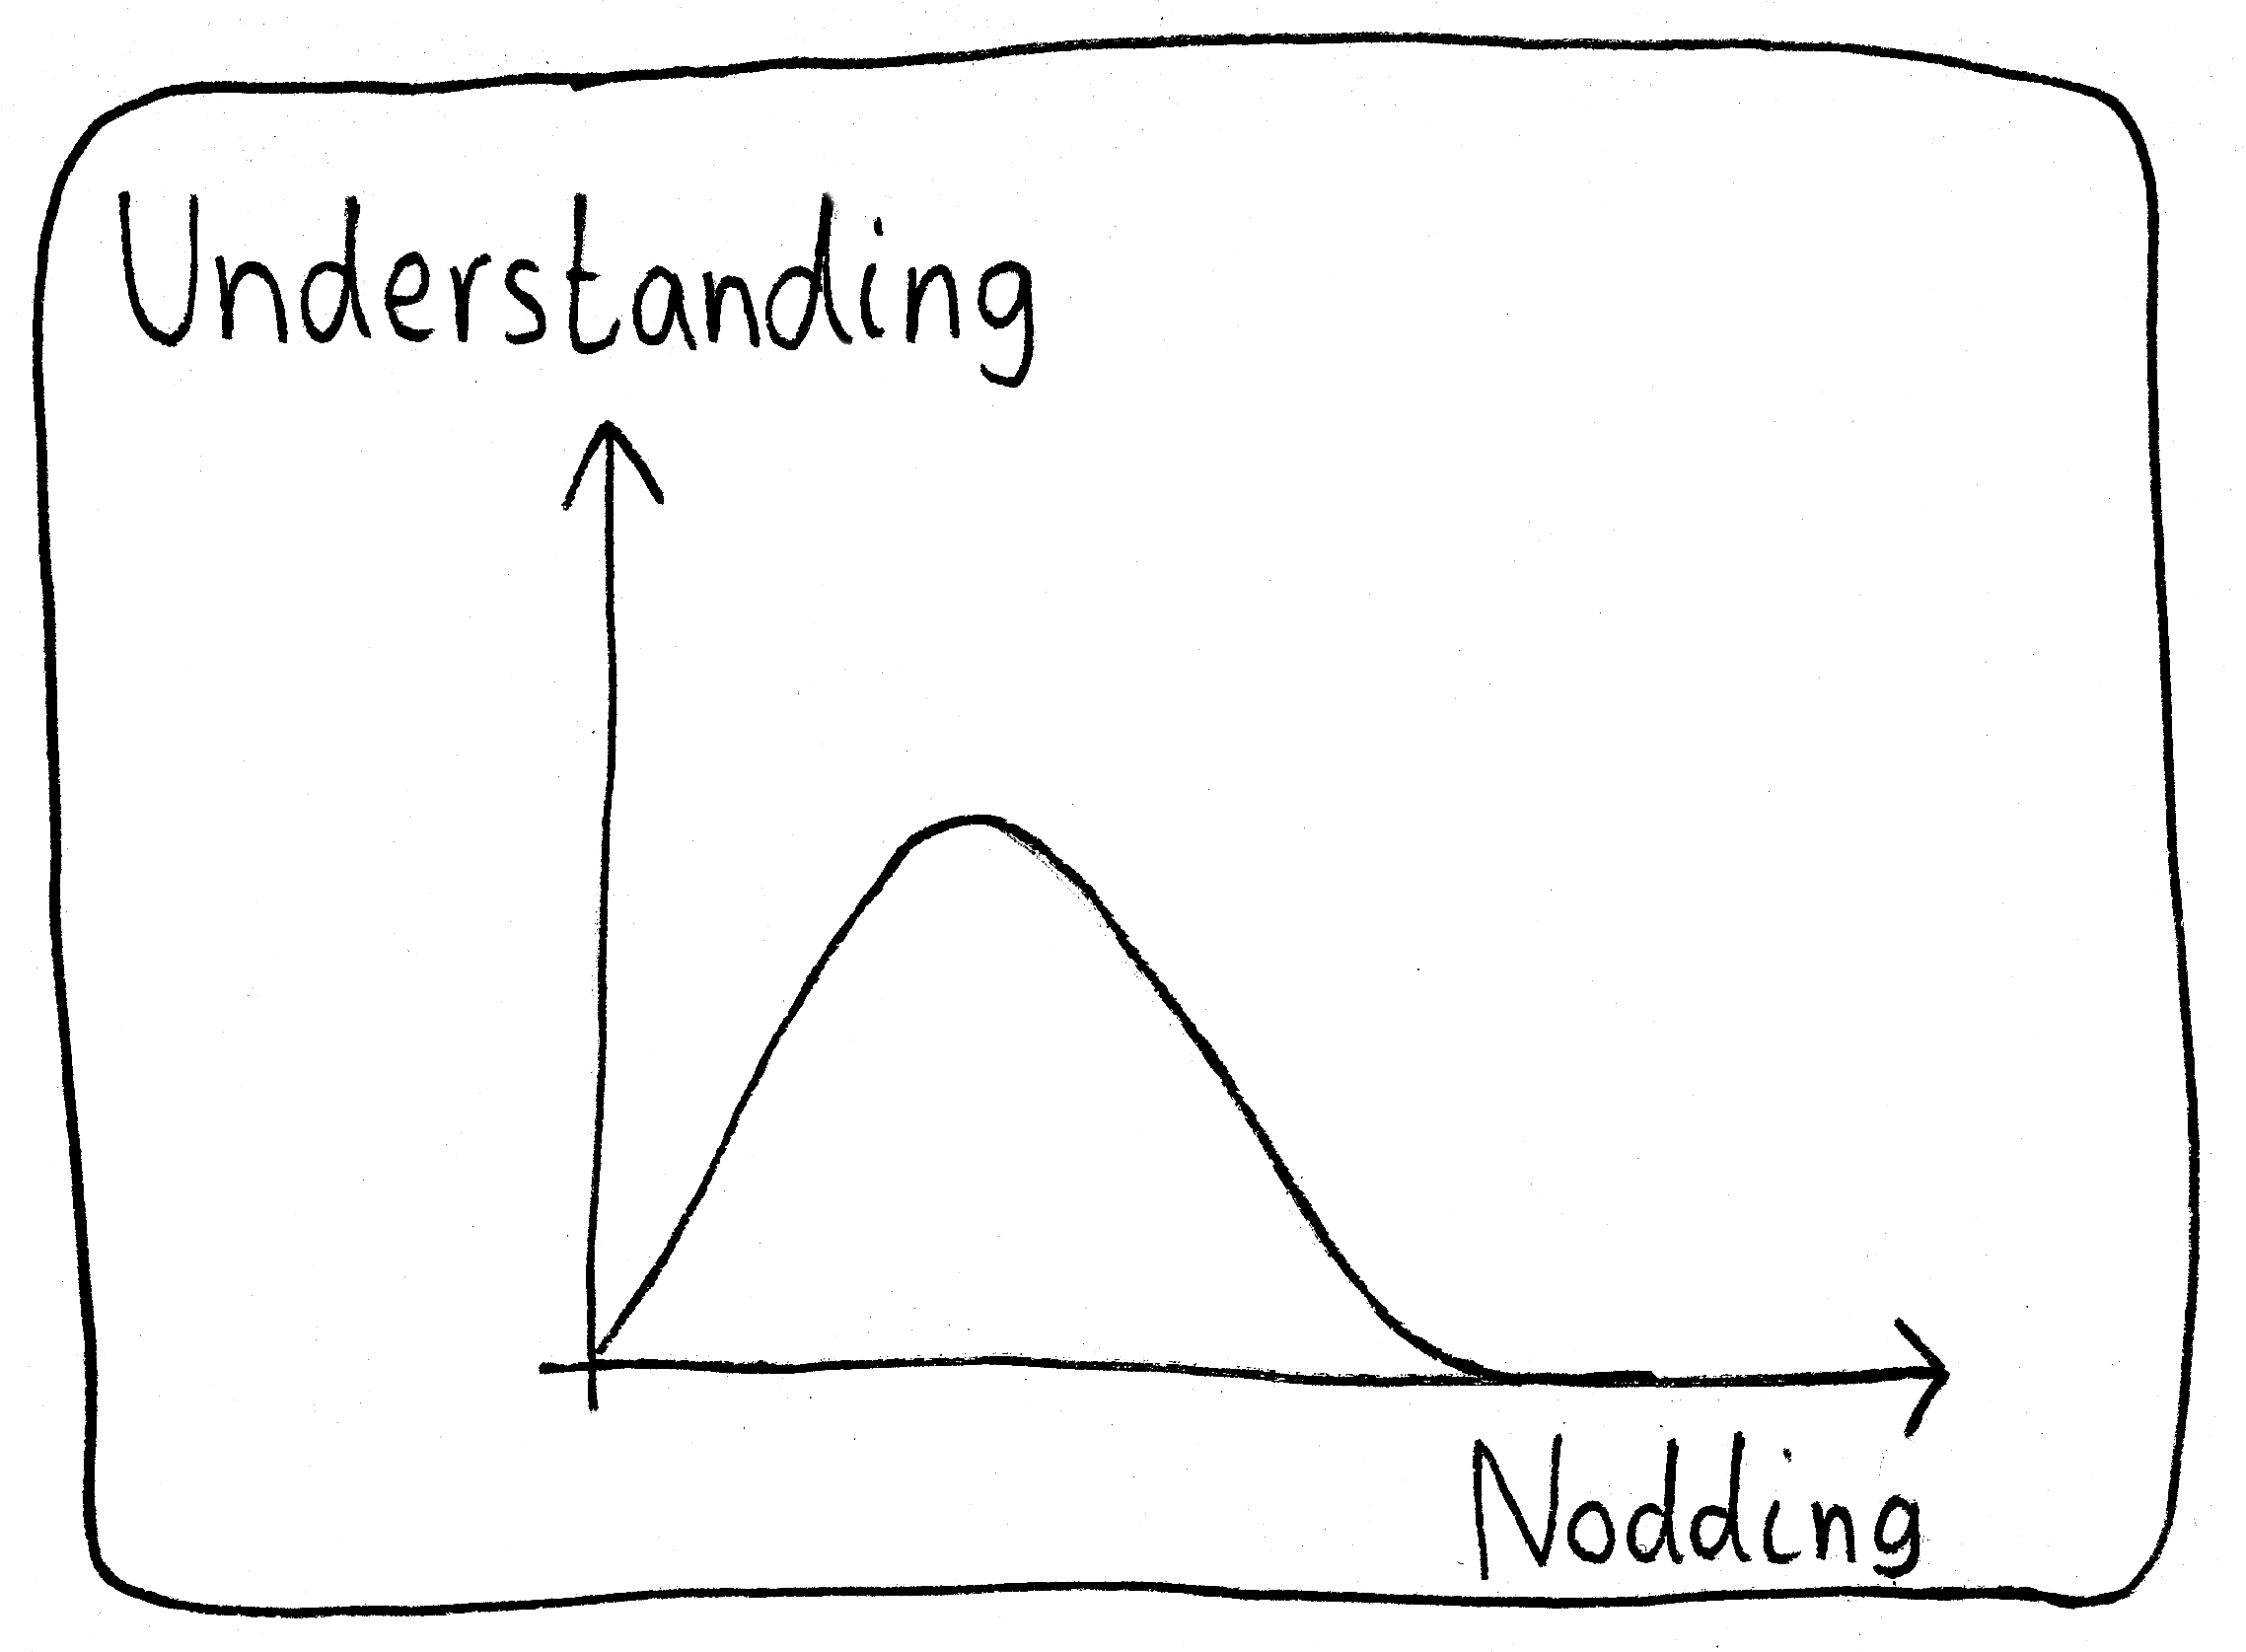
“Wait, I always thought those blank looks and nodding meant that what I was teaching was too easy…?”
30 Dec 2022
Sock Classification
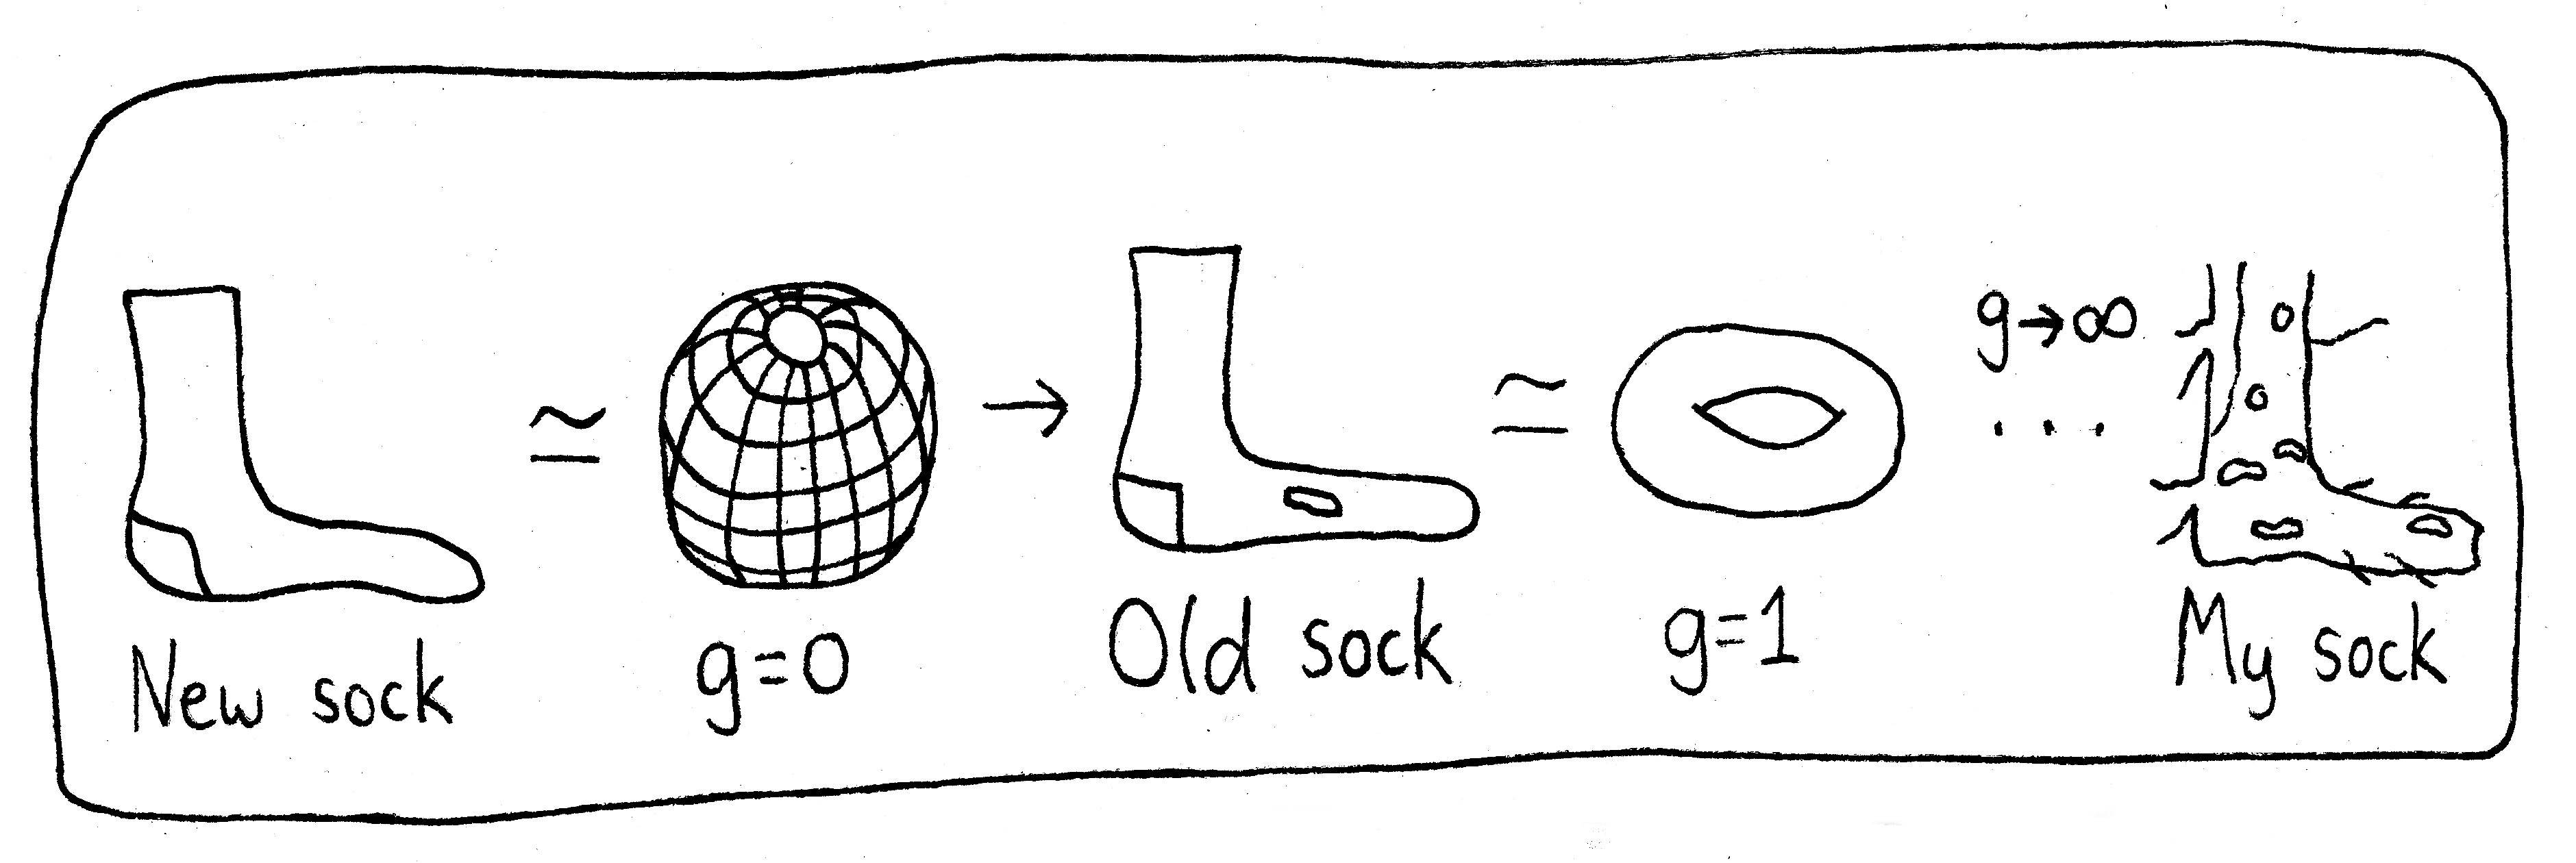
In surprising news, my socks provided a new avenue into the classification of topological spaces.
21 Dec 2022
Tunneling
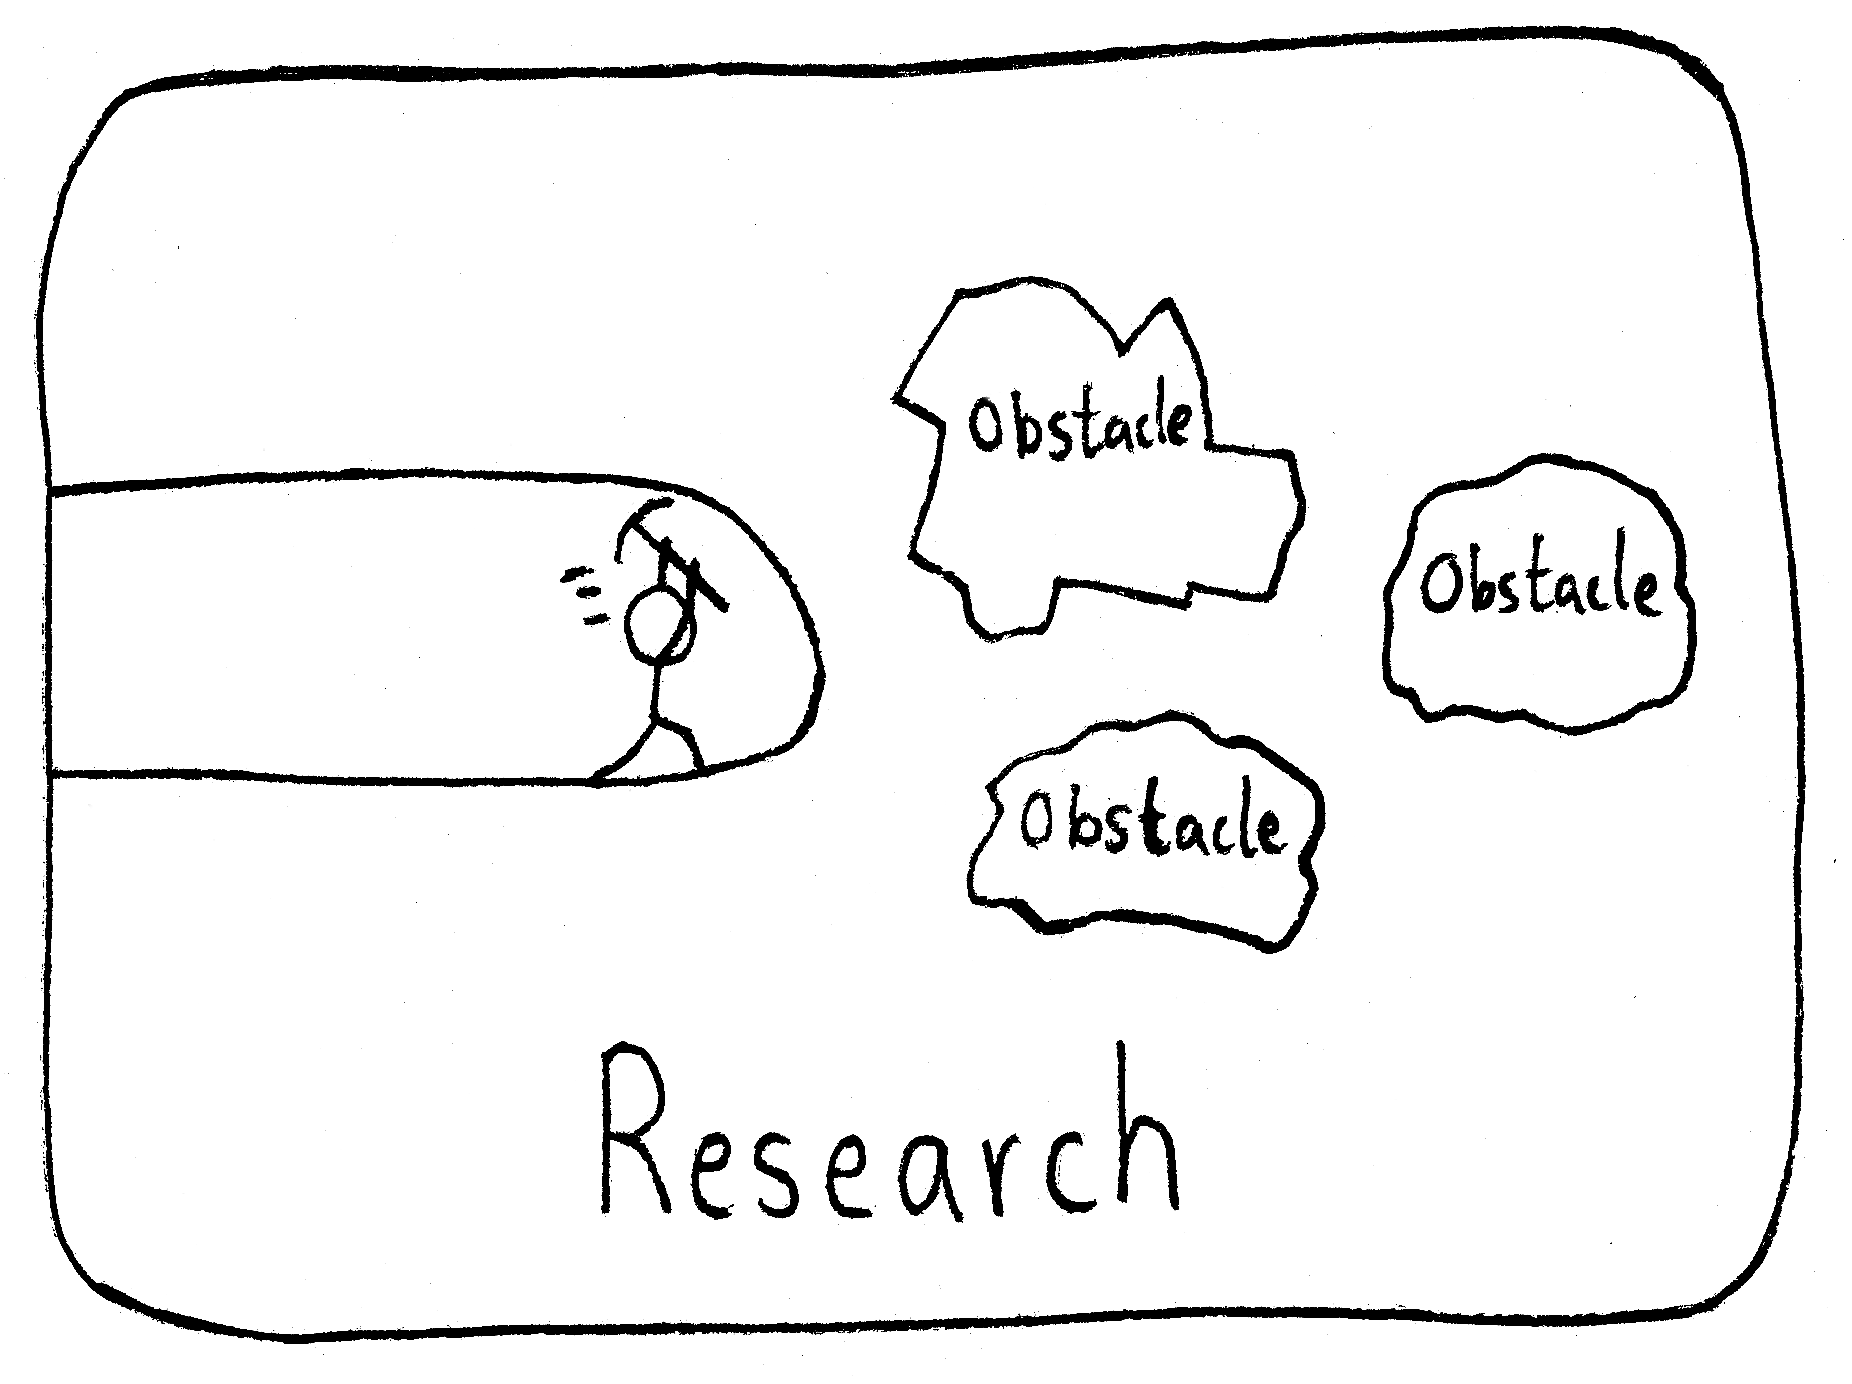
I’m forever bracing myself in research for the inevitable moments when things go wrong. But on the other hand, there are also those moments where things go right!
16 Dec 2022