 Comics about mathematics, science, and the student life.
Sawtooth

Note to self: “Powering through” the breaks results in negative ambition at the beginning of the new semester.
25 Jan 2023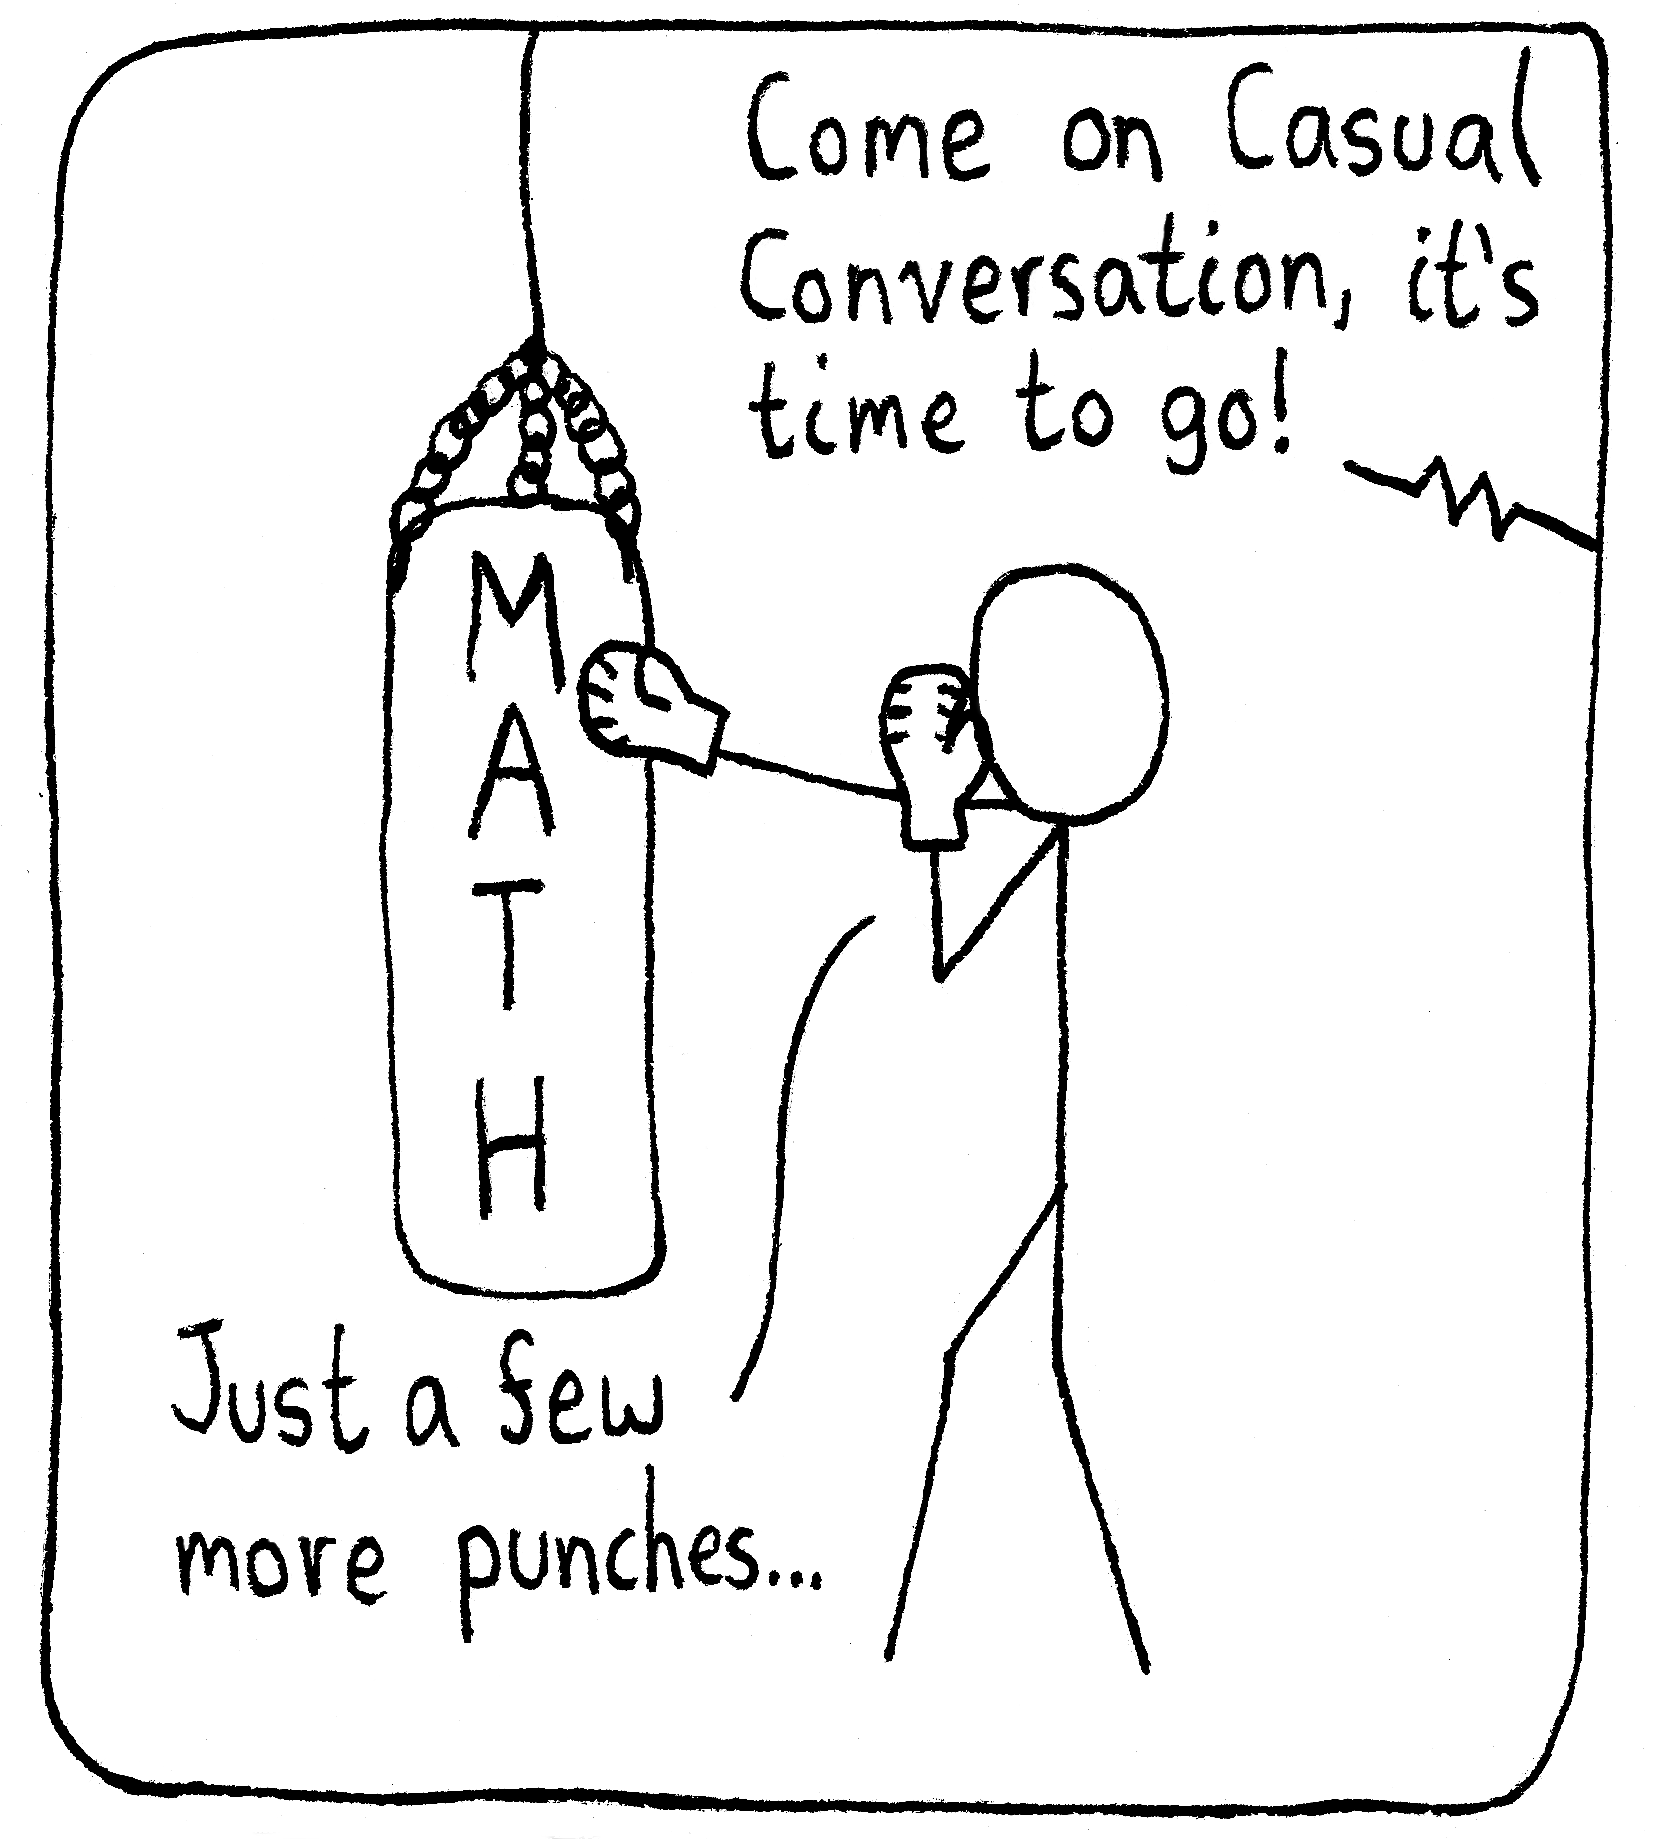
Work Radius
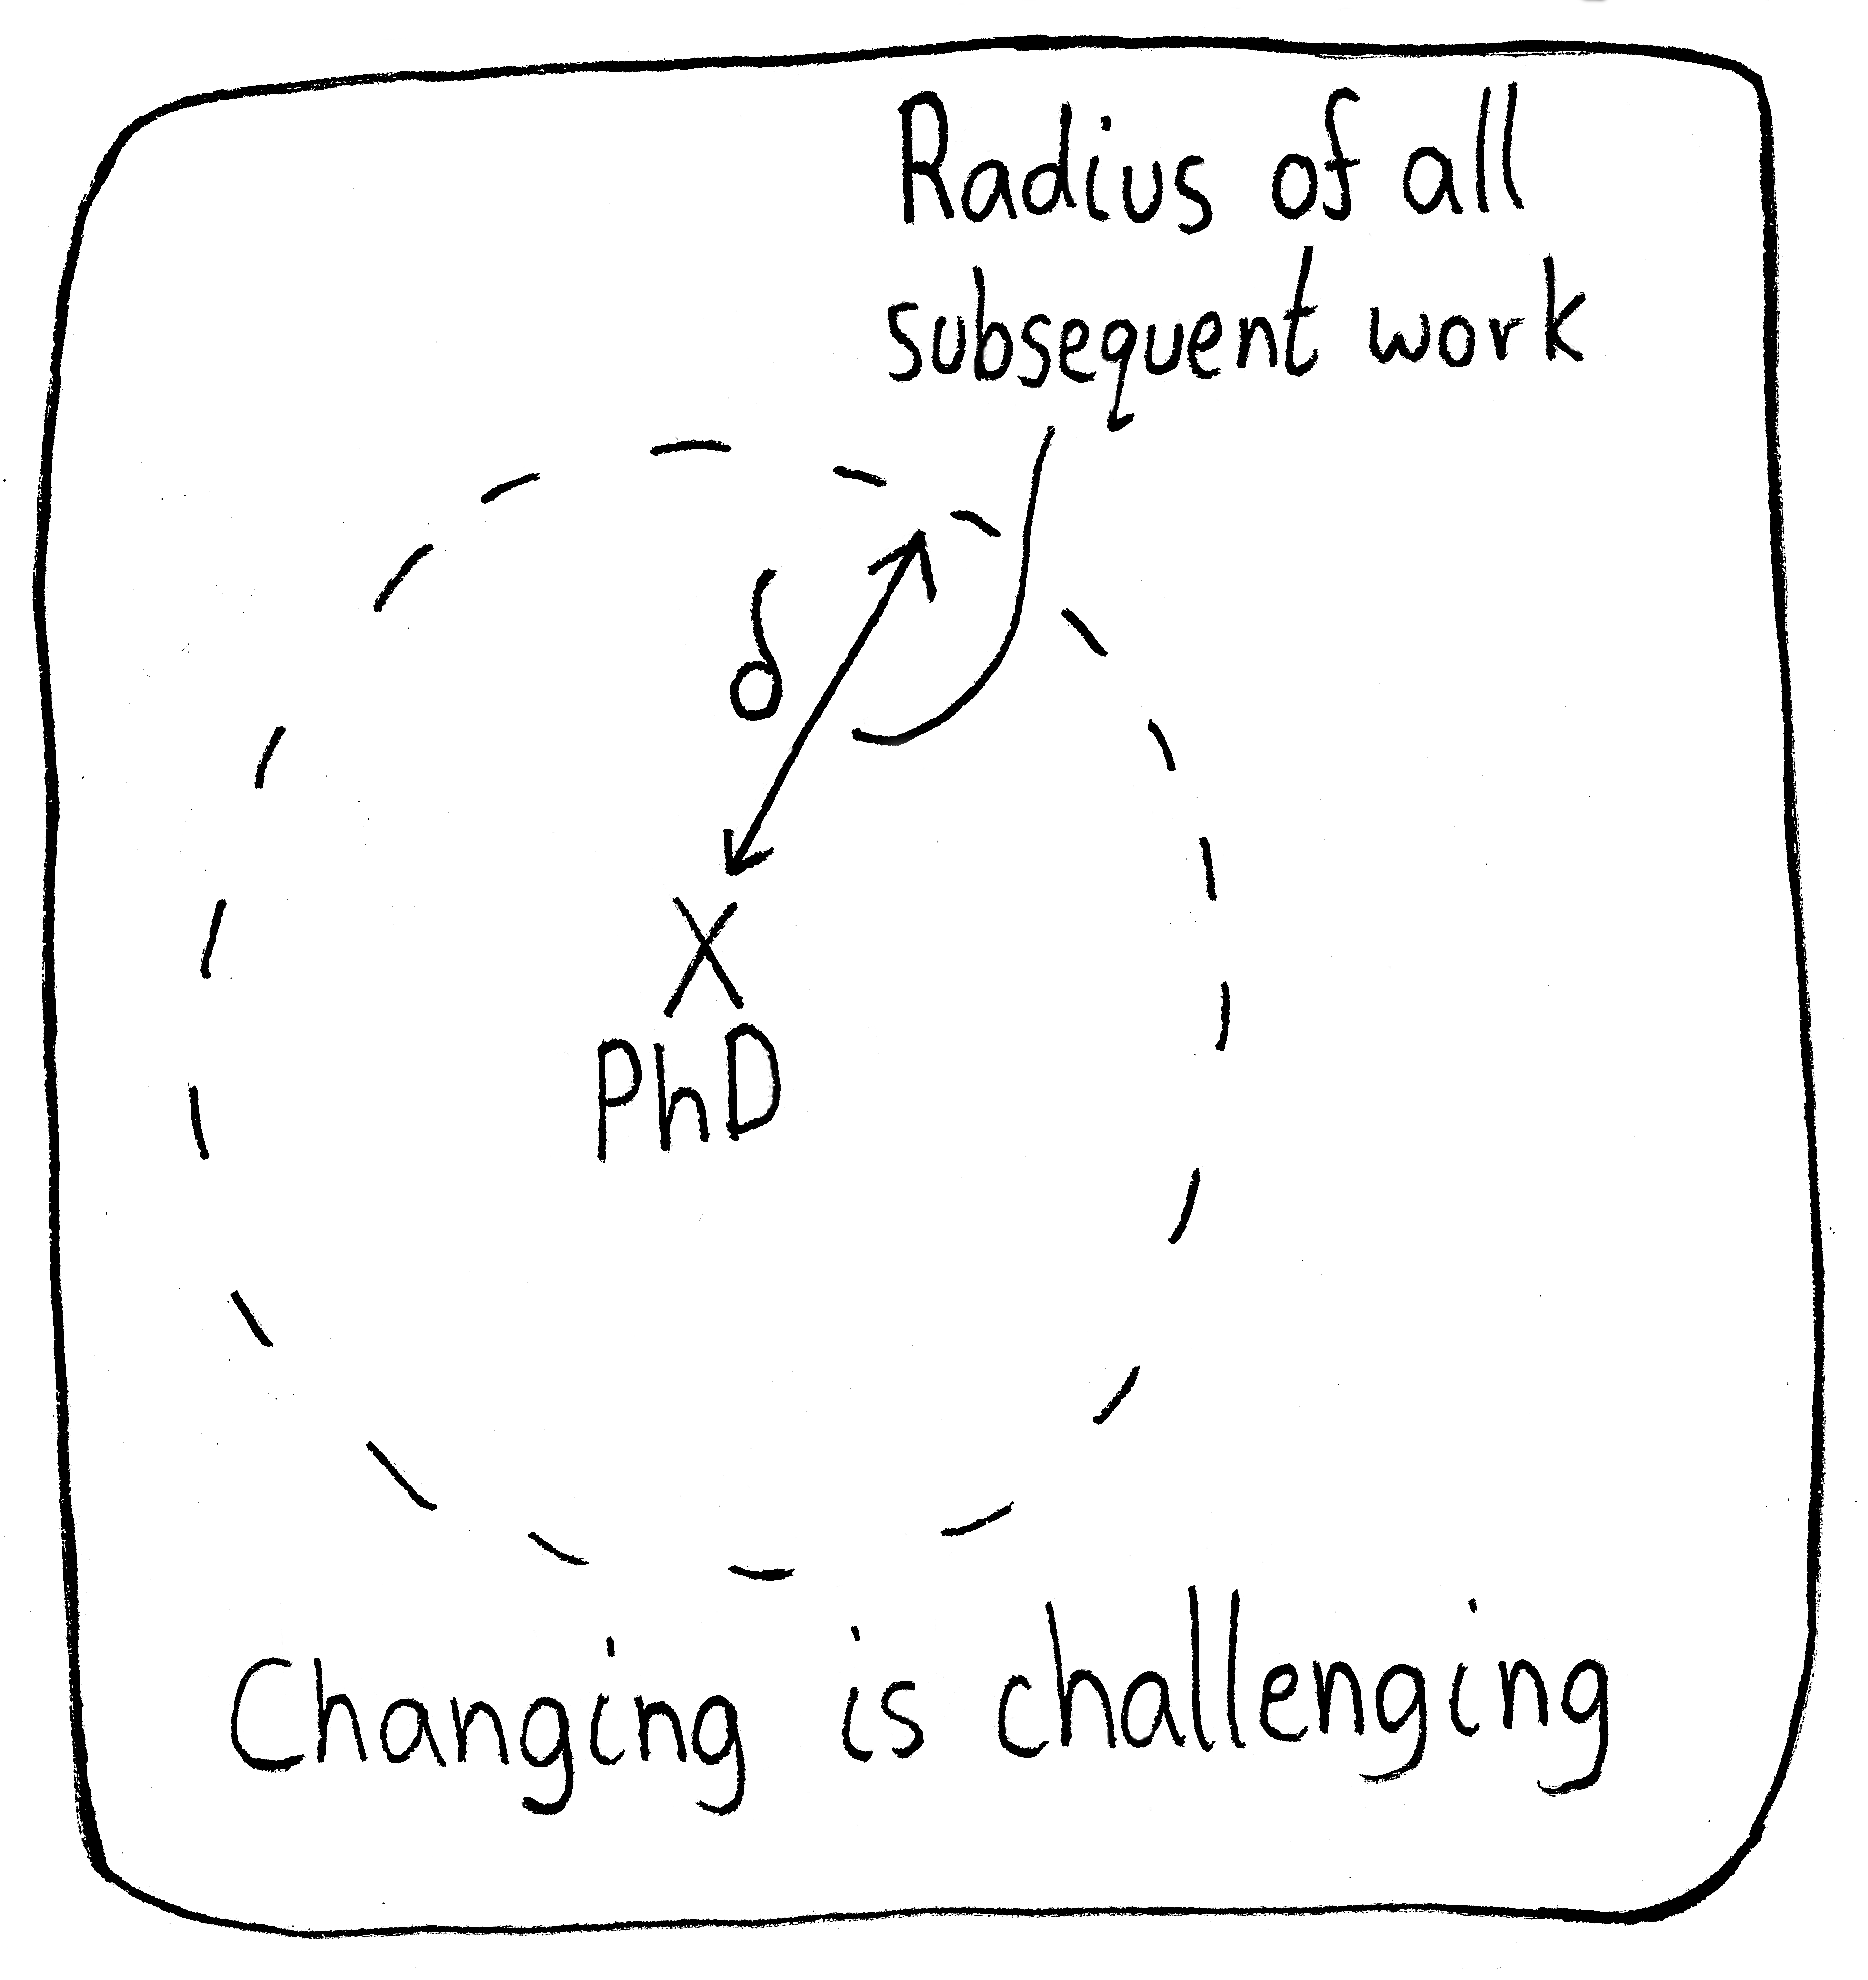
Diving deep into one area your whole life can be very rewarding, but I think dipping into various fields can be great too!
20 Jan 2023Model Warranty
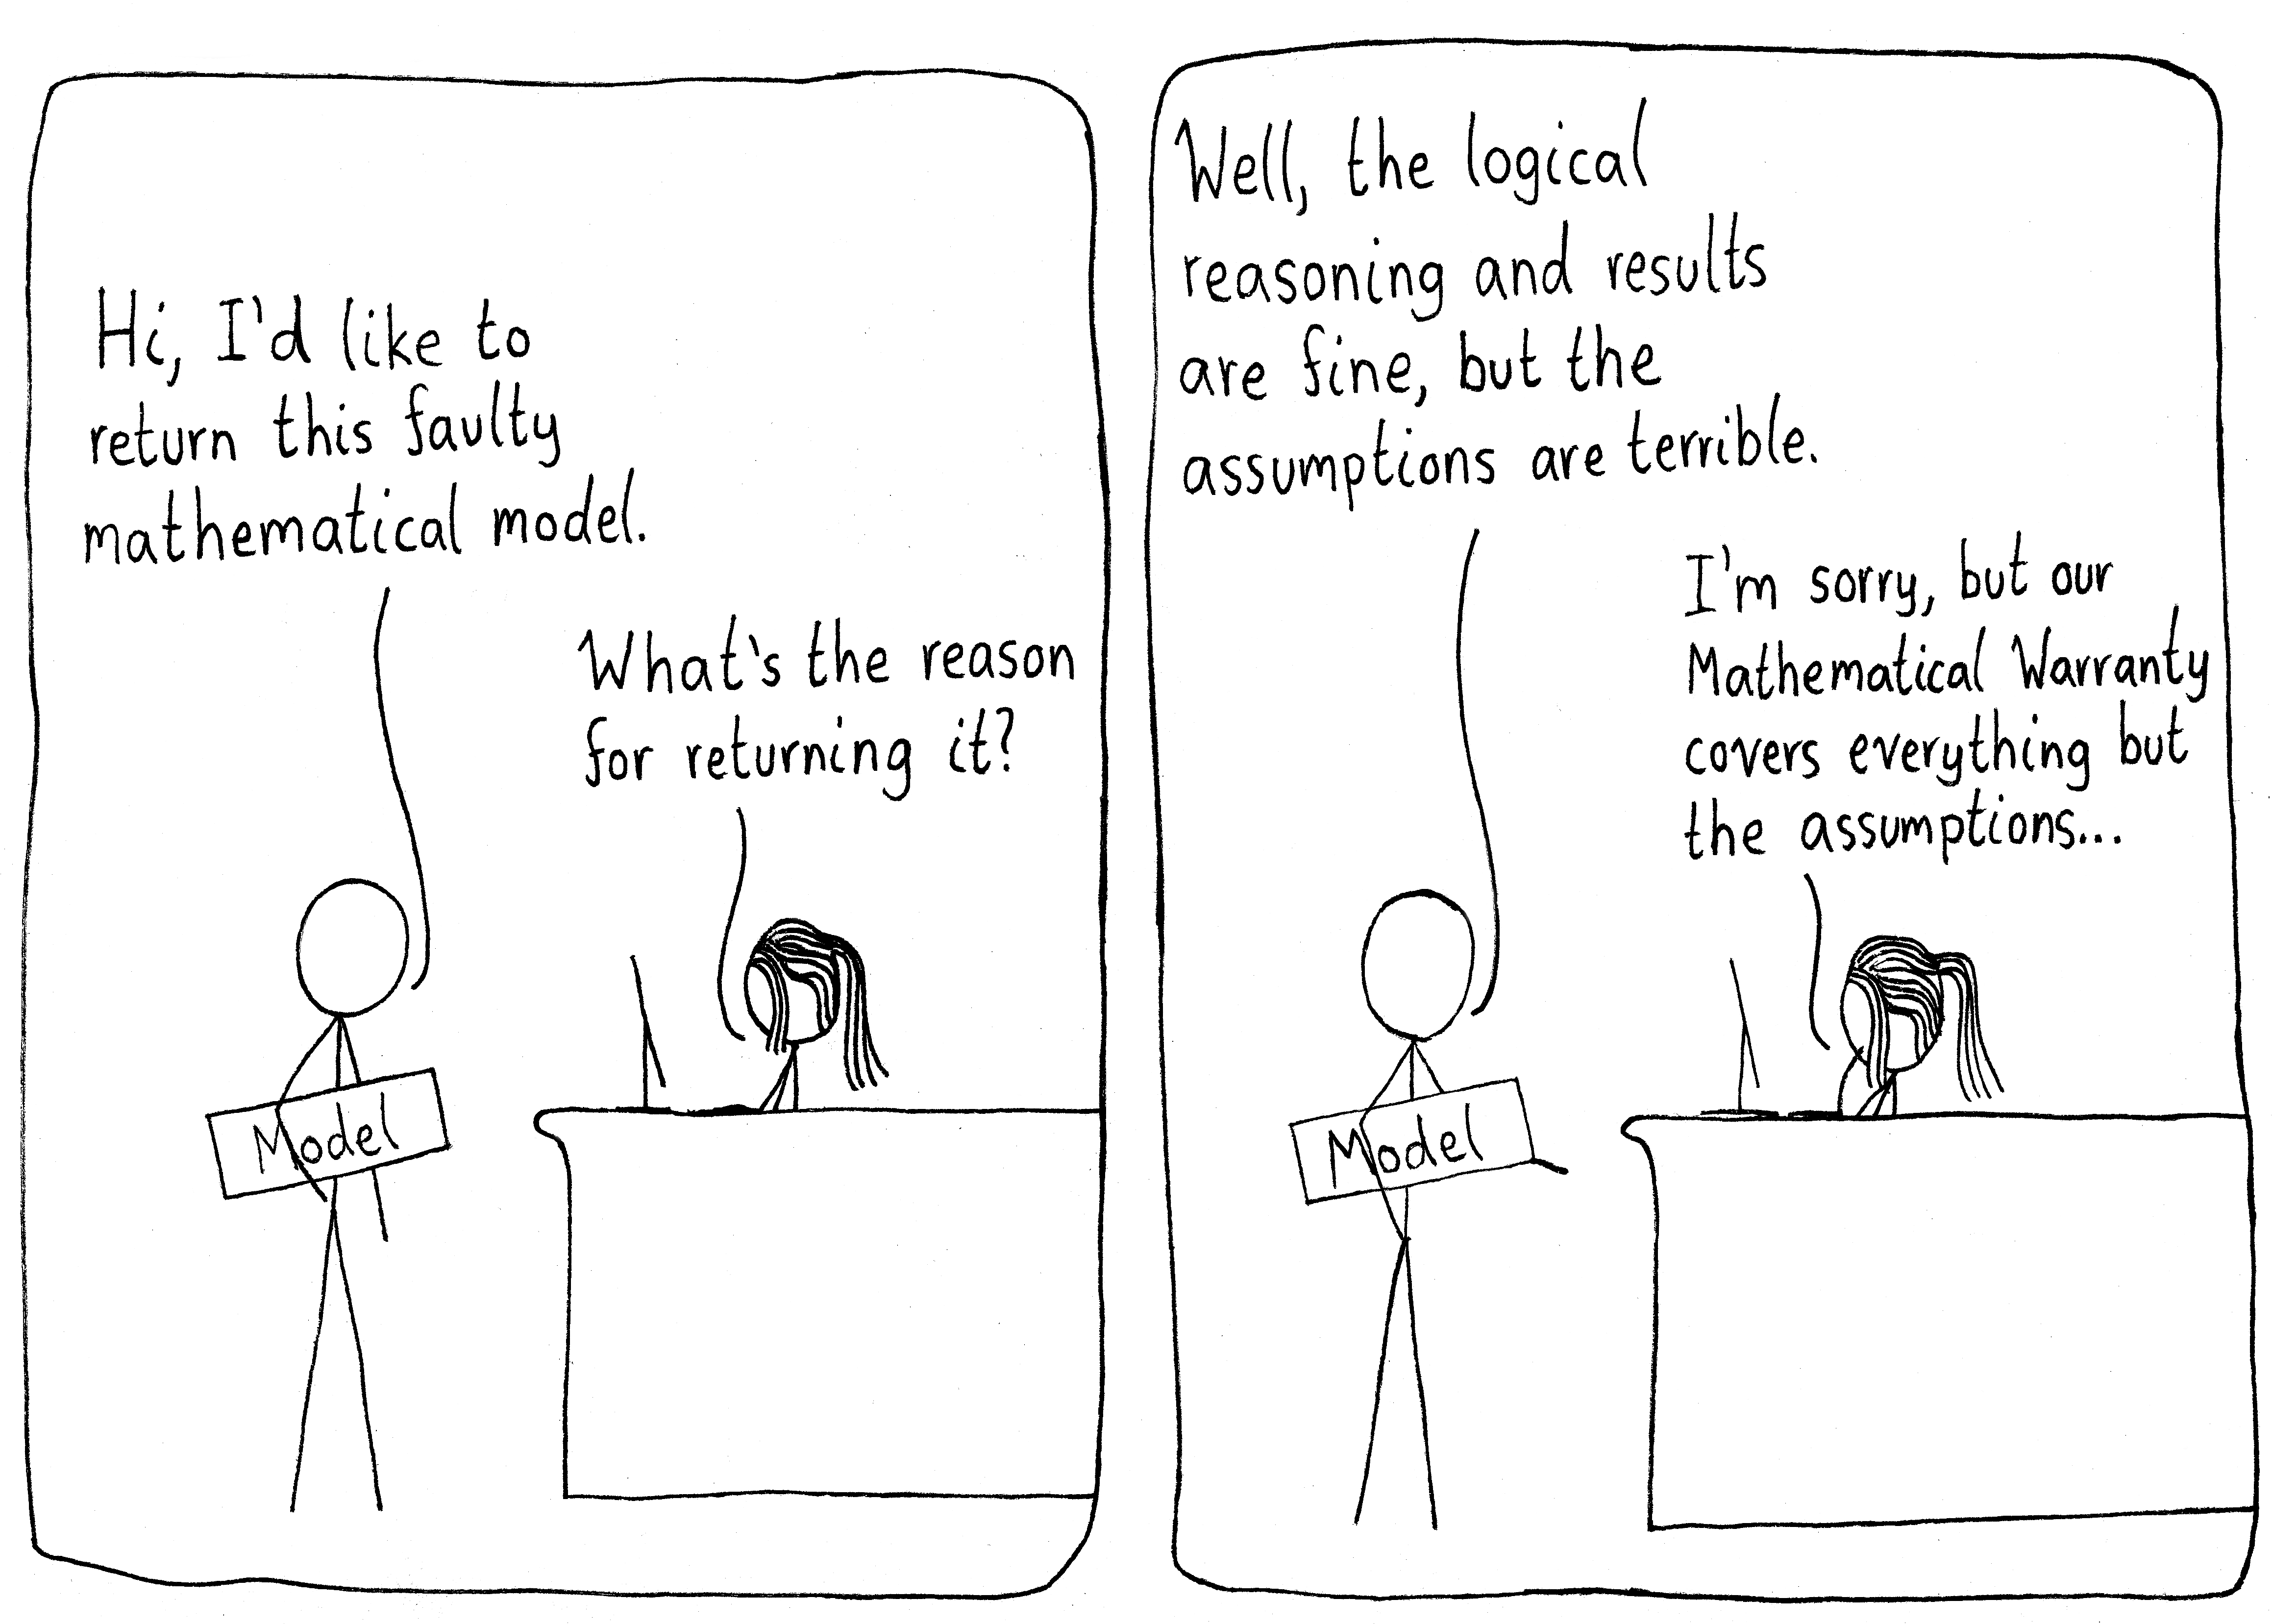
In reality, the person would never return the model, because it gave the results they wanted anyway.
18 Jan 2023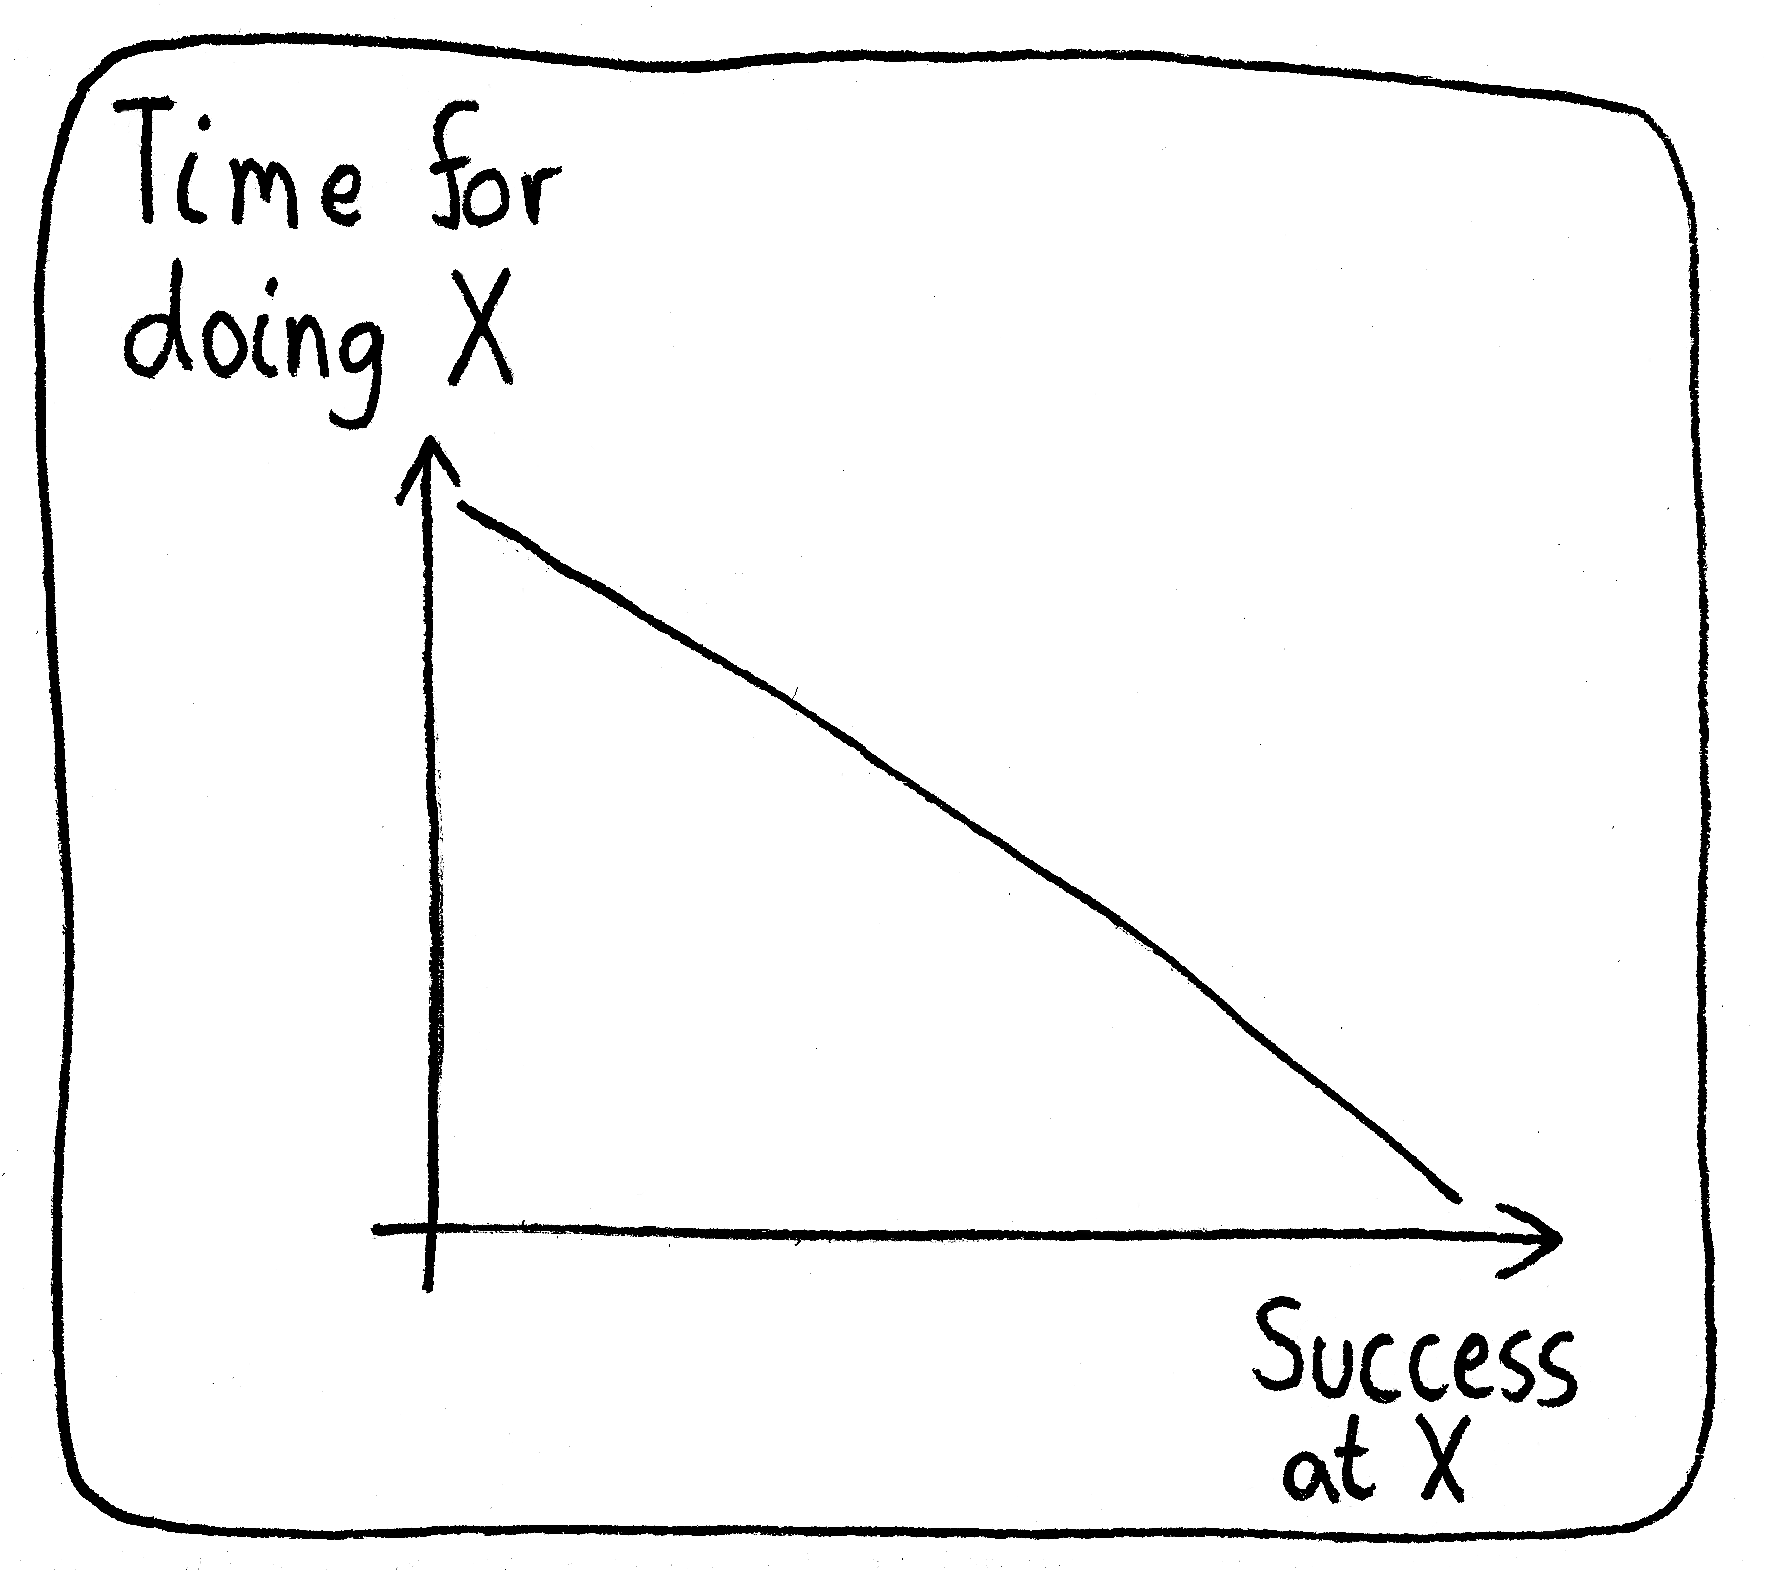
Appropriated
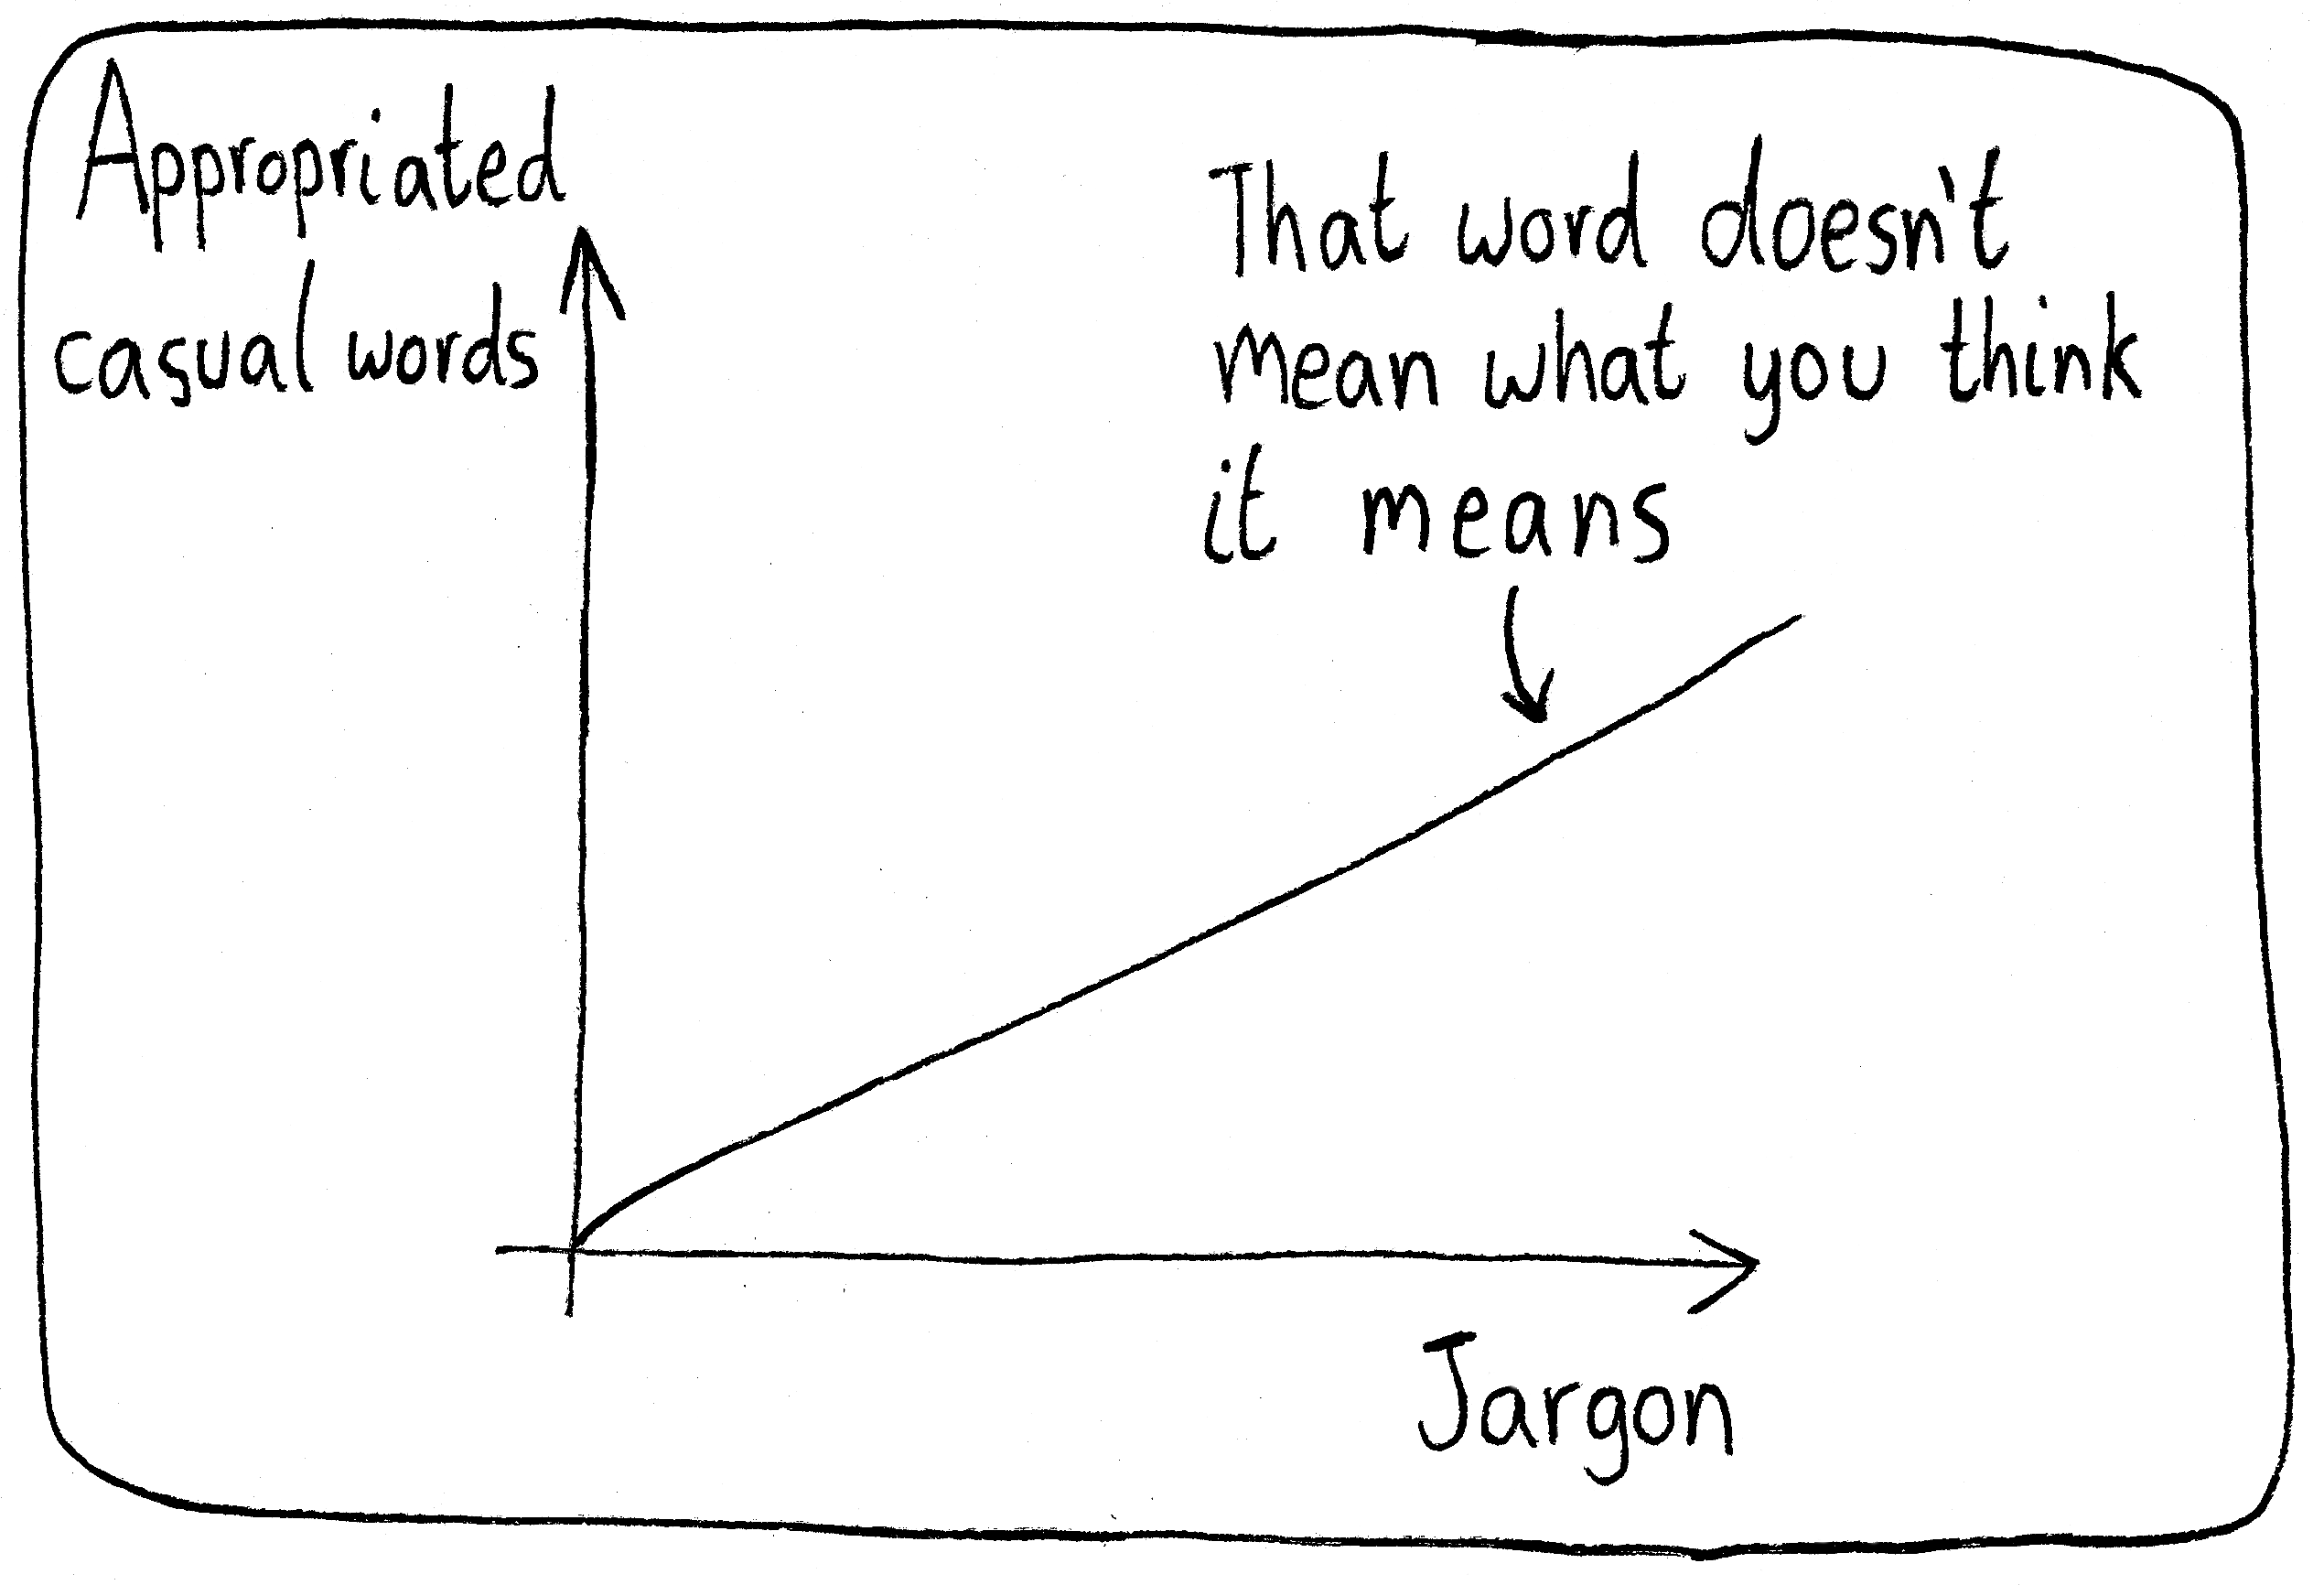
“Hey, were you really expecting us to use our creativity to come up with new words when all of these old words were just sitting there?”
13 Jan 2023
Possibility of Failure

Instead of seeing failure as a binary quantity (either it happened or it didn’t), perhaps it’s more healthy to adopt the view that there’s always going to be some amount of failure, and our job is to limit it as much as possible.
09 Jan 2023