 Comics about mathematics, science, and the student life.
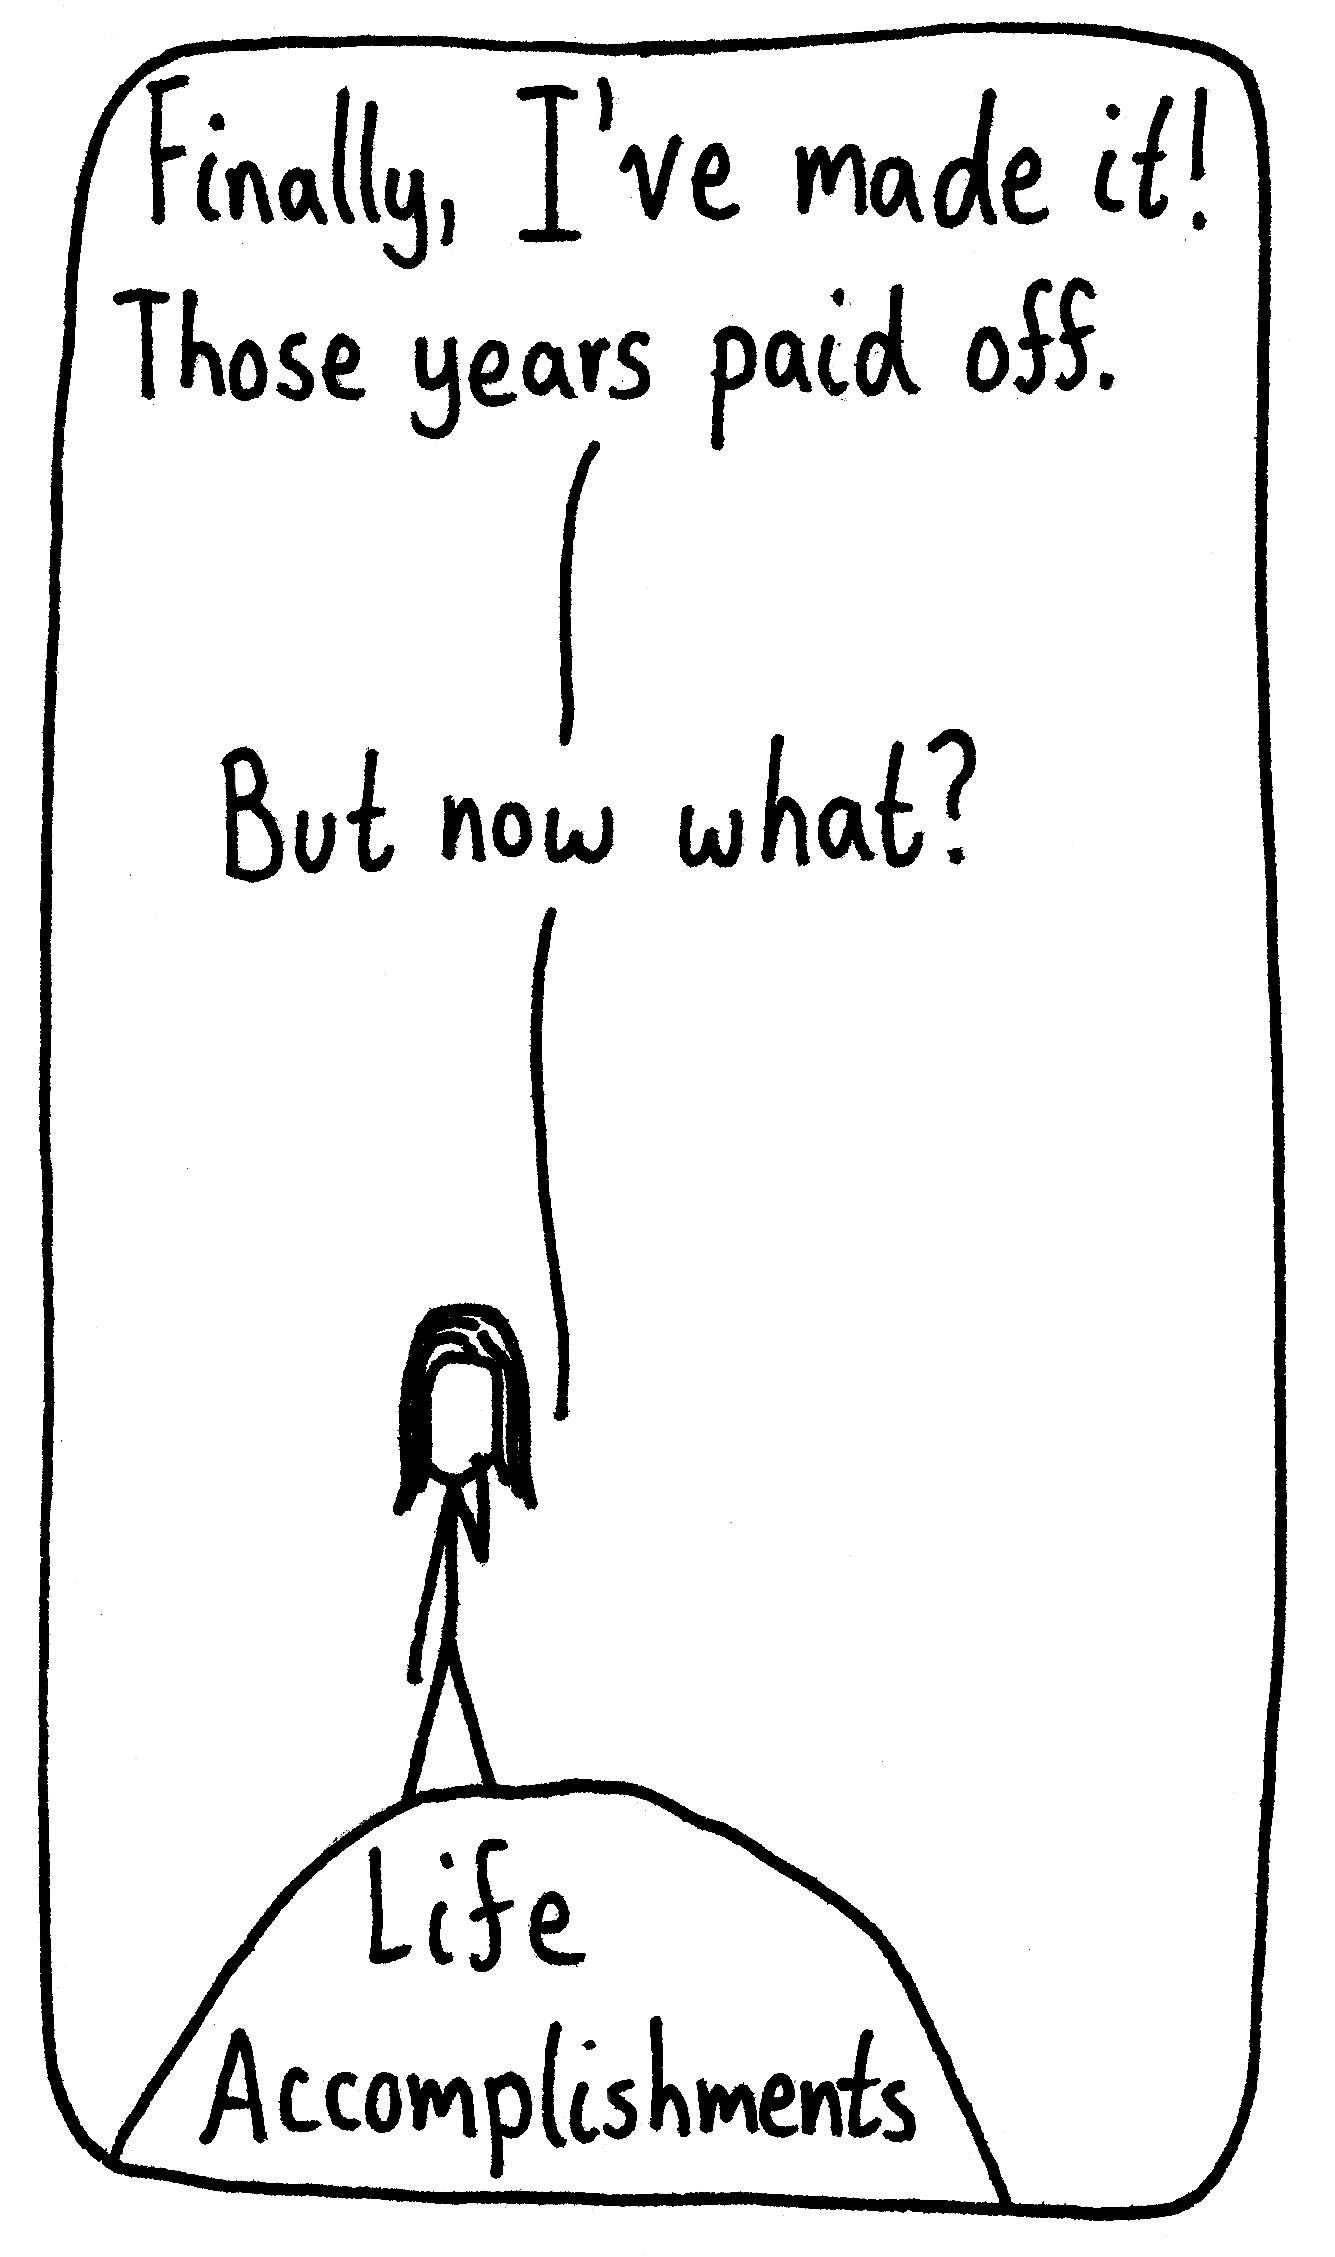
School's Out

“But wouldn’t it be cool to build up some skills?”
“It would be even cooler to free up some headspace from all that useless stuff I had to cram in for our exams.”
16 Jun 2023

Weird
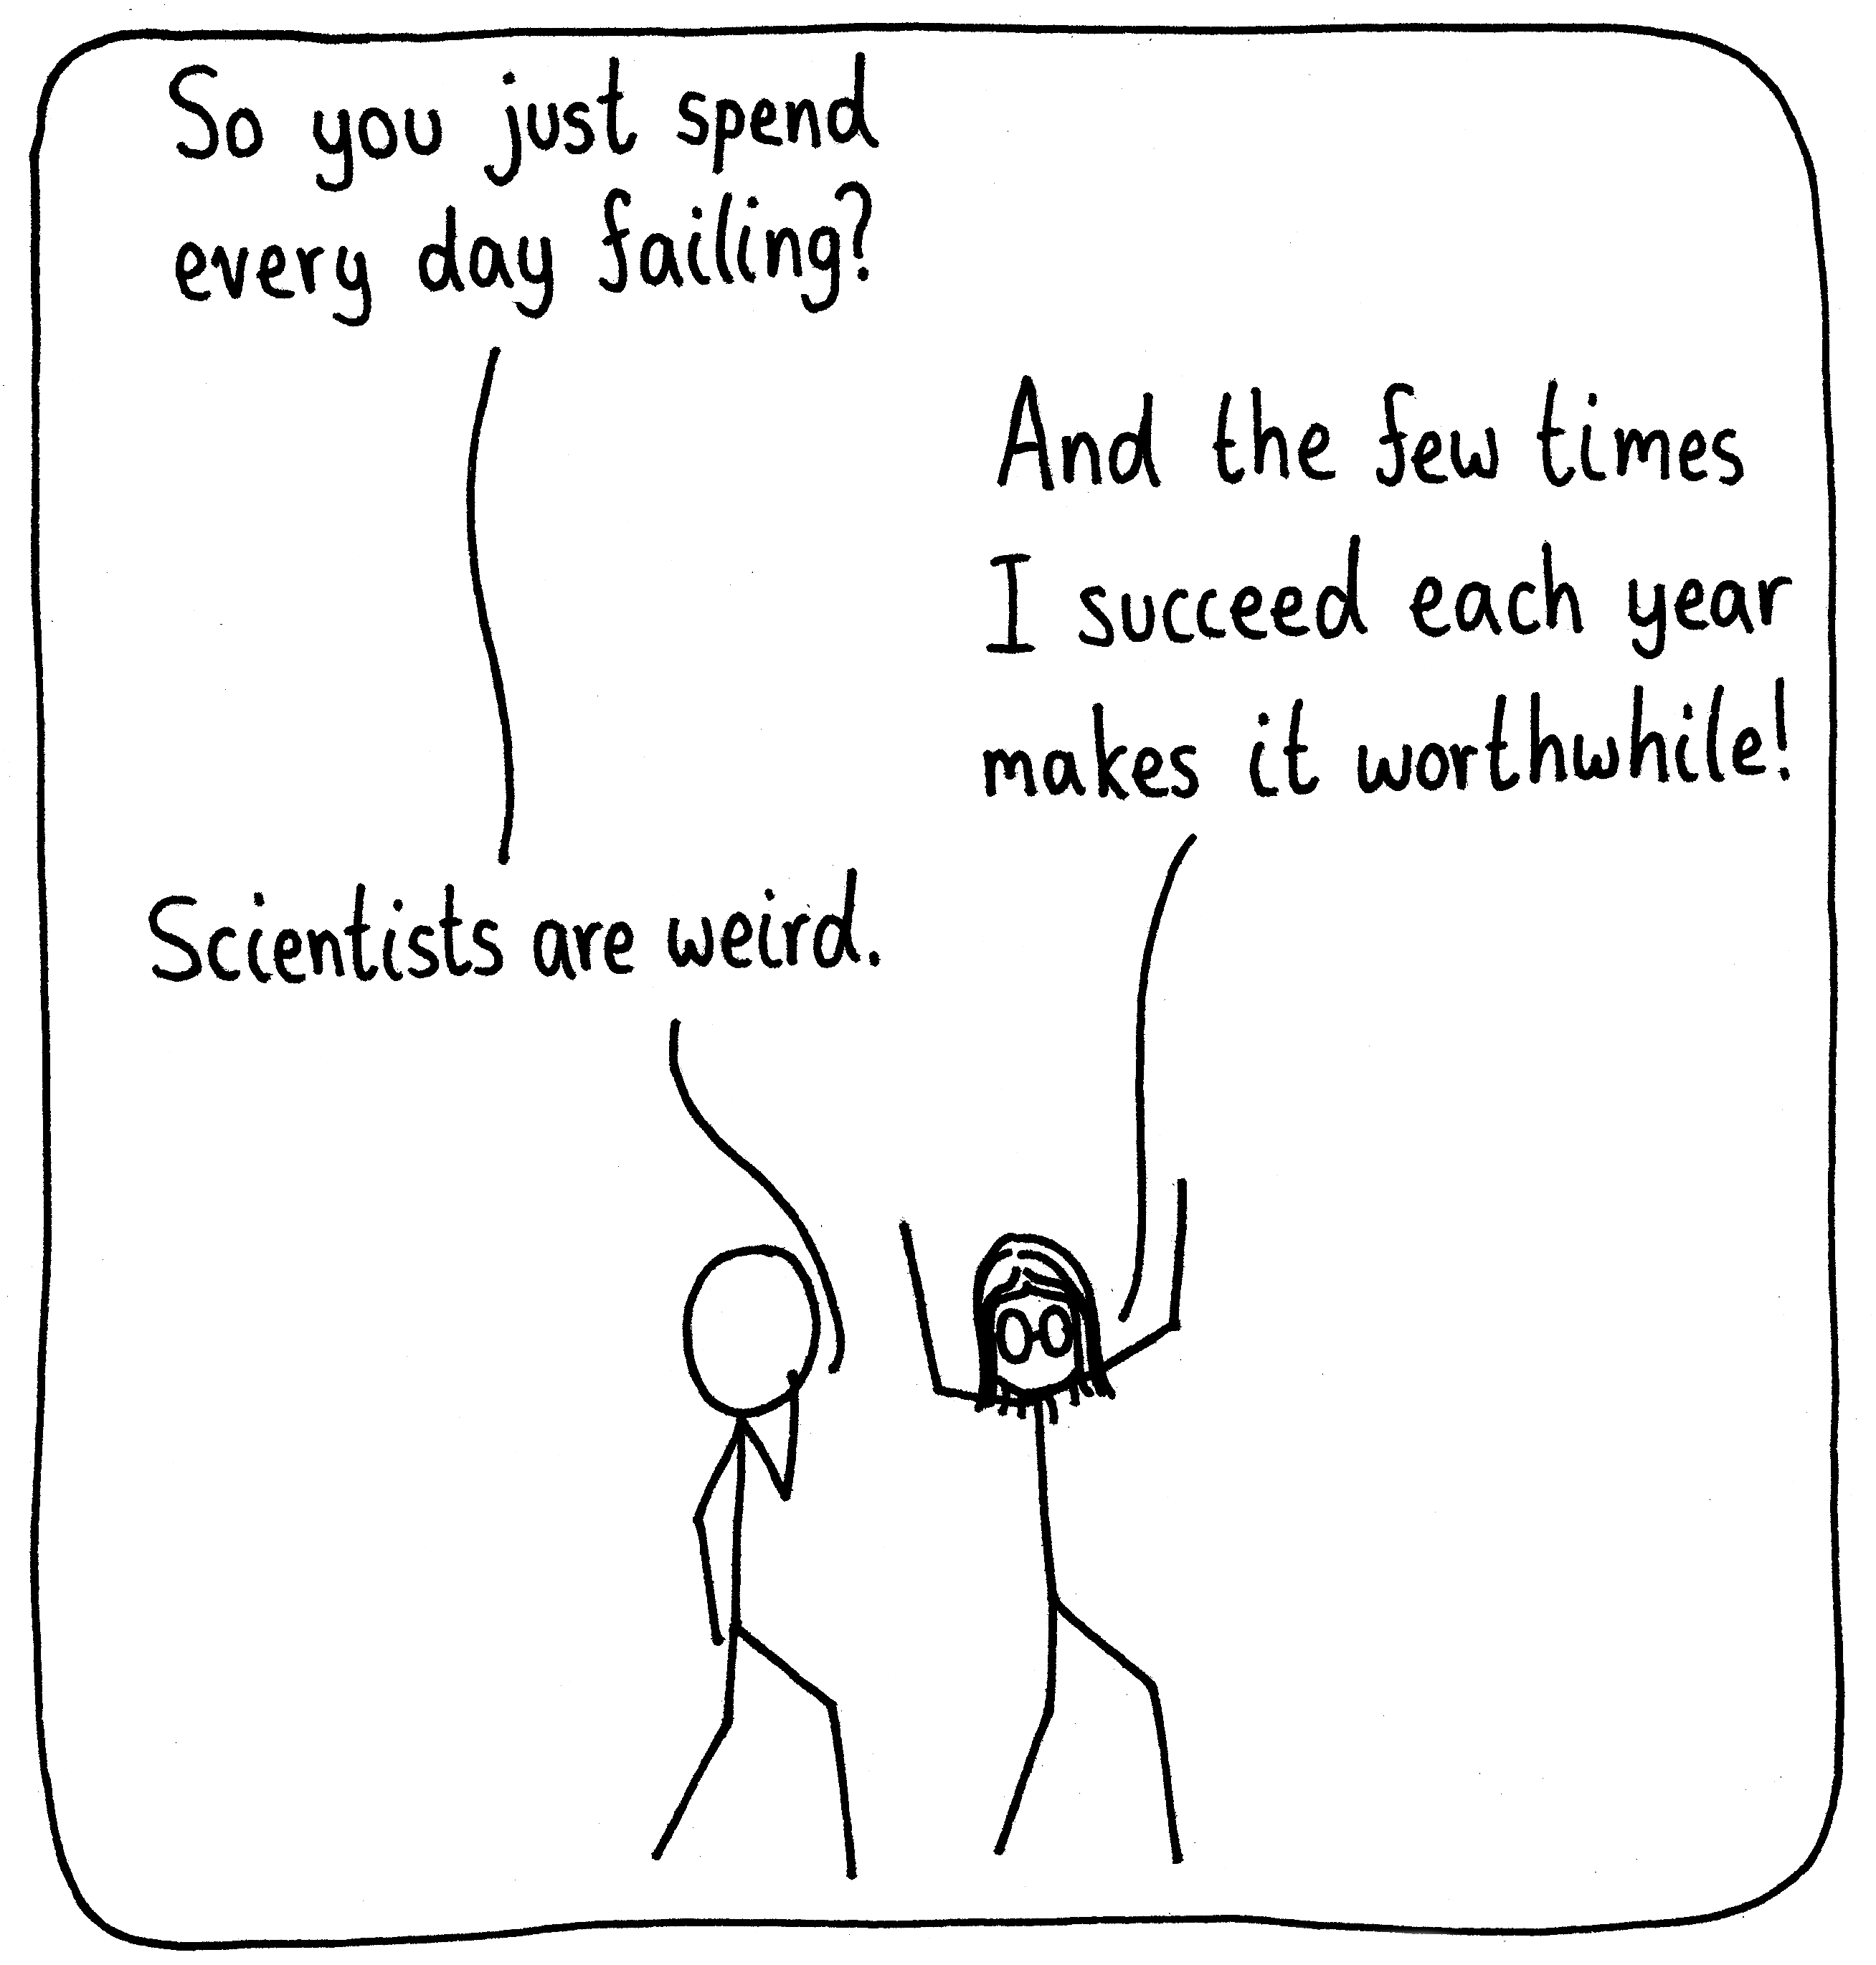
“That one time, I went about a decade without any real breakthrough. But it felt really good when I had it!”
05 Jun 2023

Migration

I suppose the corollary is that researchers figure out which buzzwords to include in their grant applications to boost their chance at receiving funding.
29 May 2023Signpost

“I’ve been meaning to send a graduate student down that way, but I suppose you could try as well.”
26 May 2023