 Comics about mathematics, science, and the student life.
Academic Websites

I think the design has improved in recent years, but this may be biased by which academics I look up!
07 Jul 2023Language Barrier

“Isn’t mathematics supposed to be the language of science?”
“Yes, but then everybody came up with their own words to describe the same thing.”
05 Jul 2023
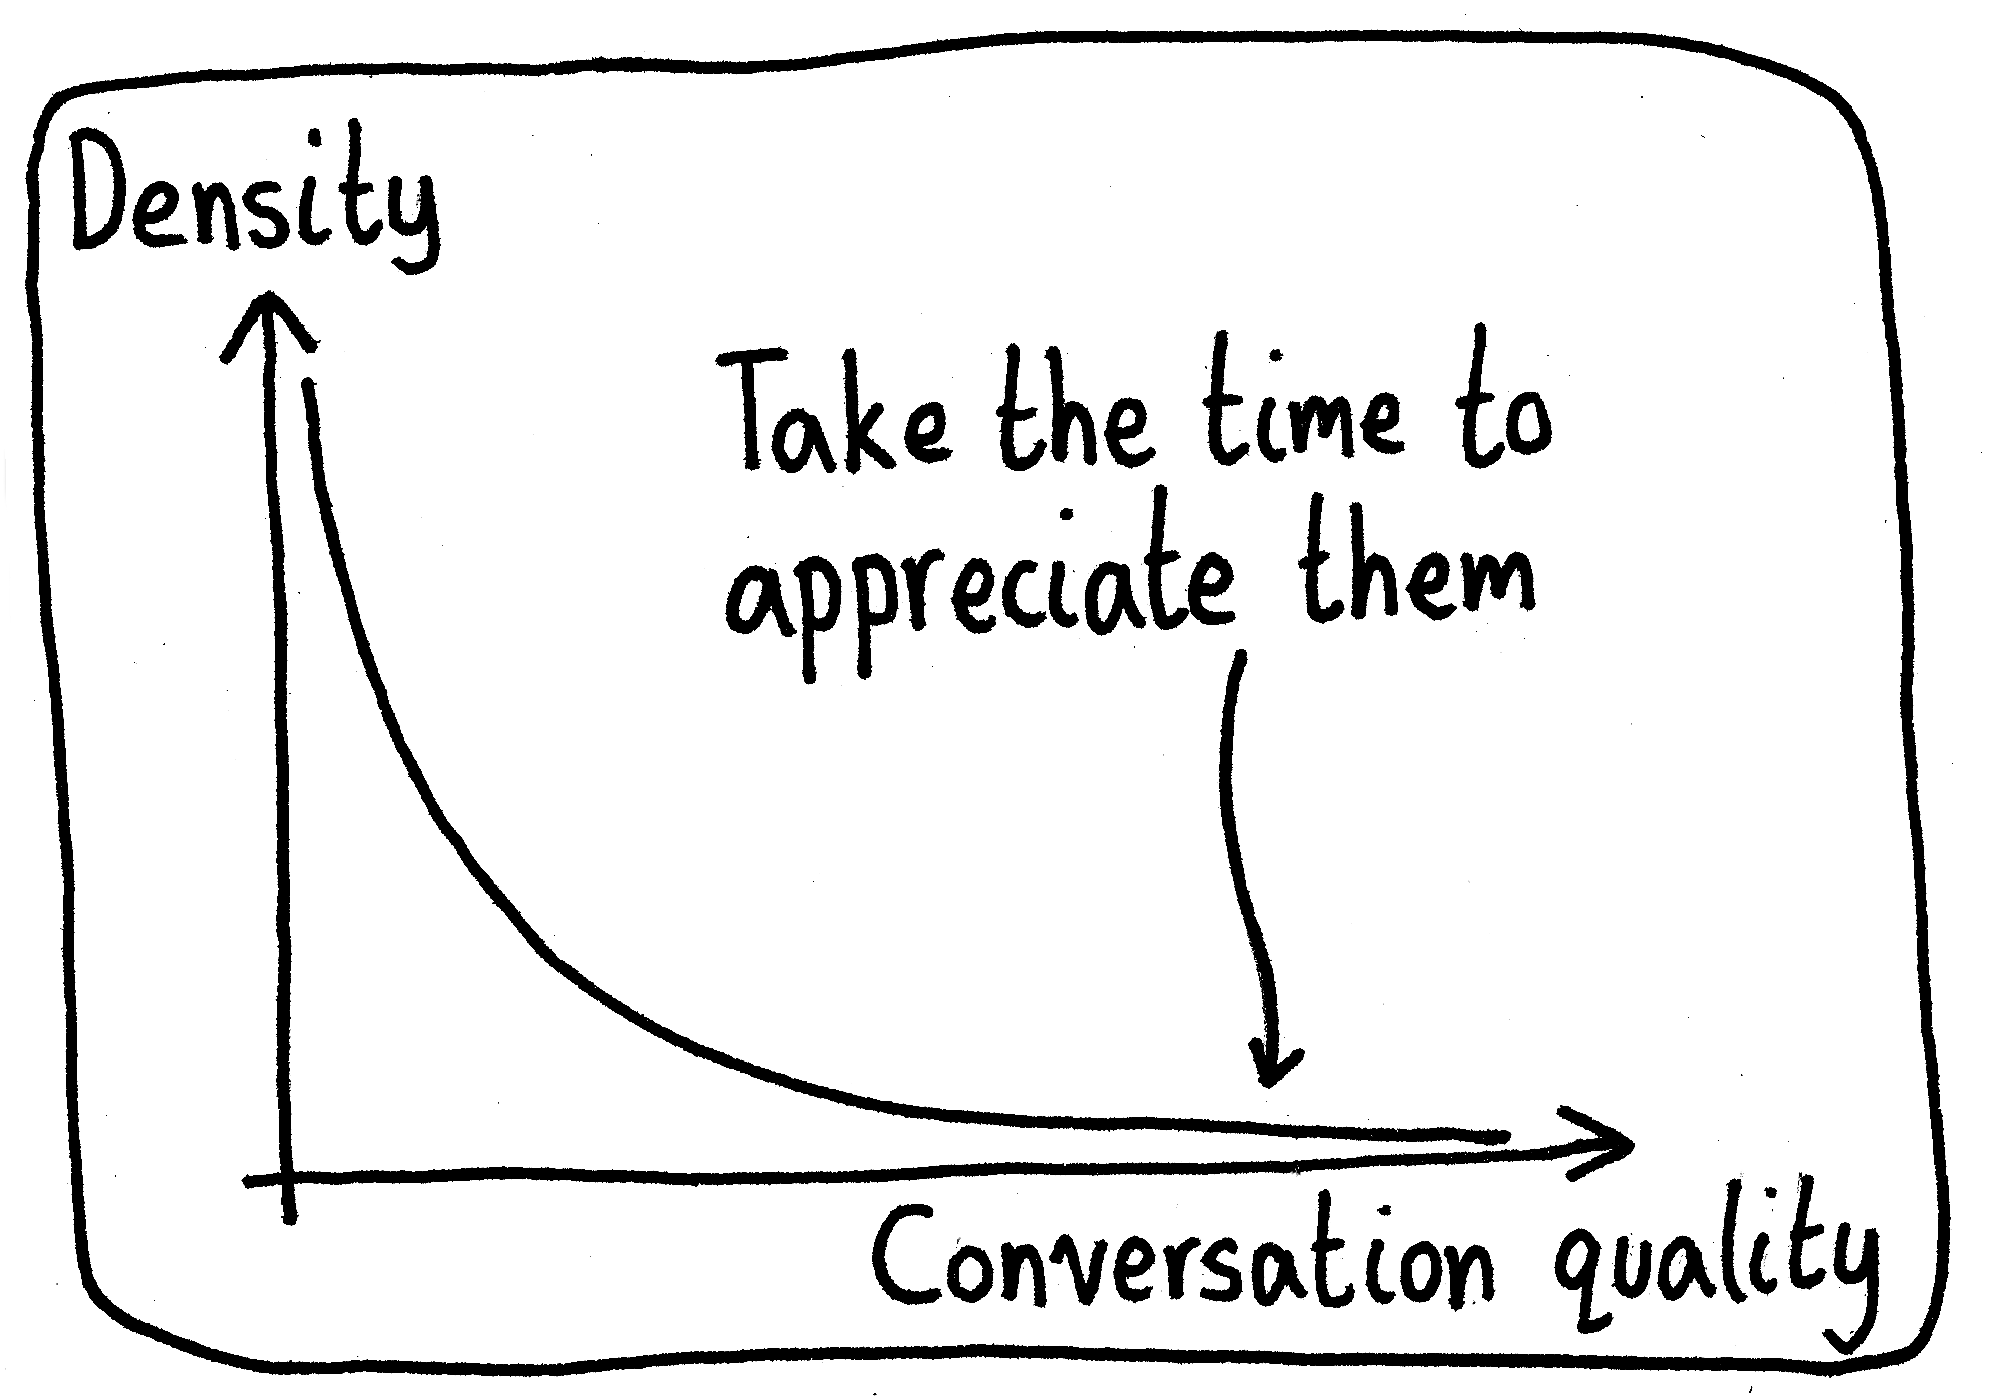
Records

I’ve wondered for a while now if the sheer quantity of data will overwhelm the speedups that come with better organization and search. Will future people studying humans of this era be able to wade through all the data with ease?
30 Jun 2023
Under a Rock
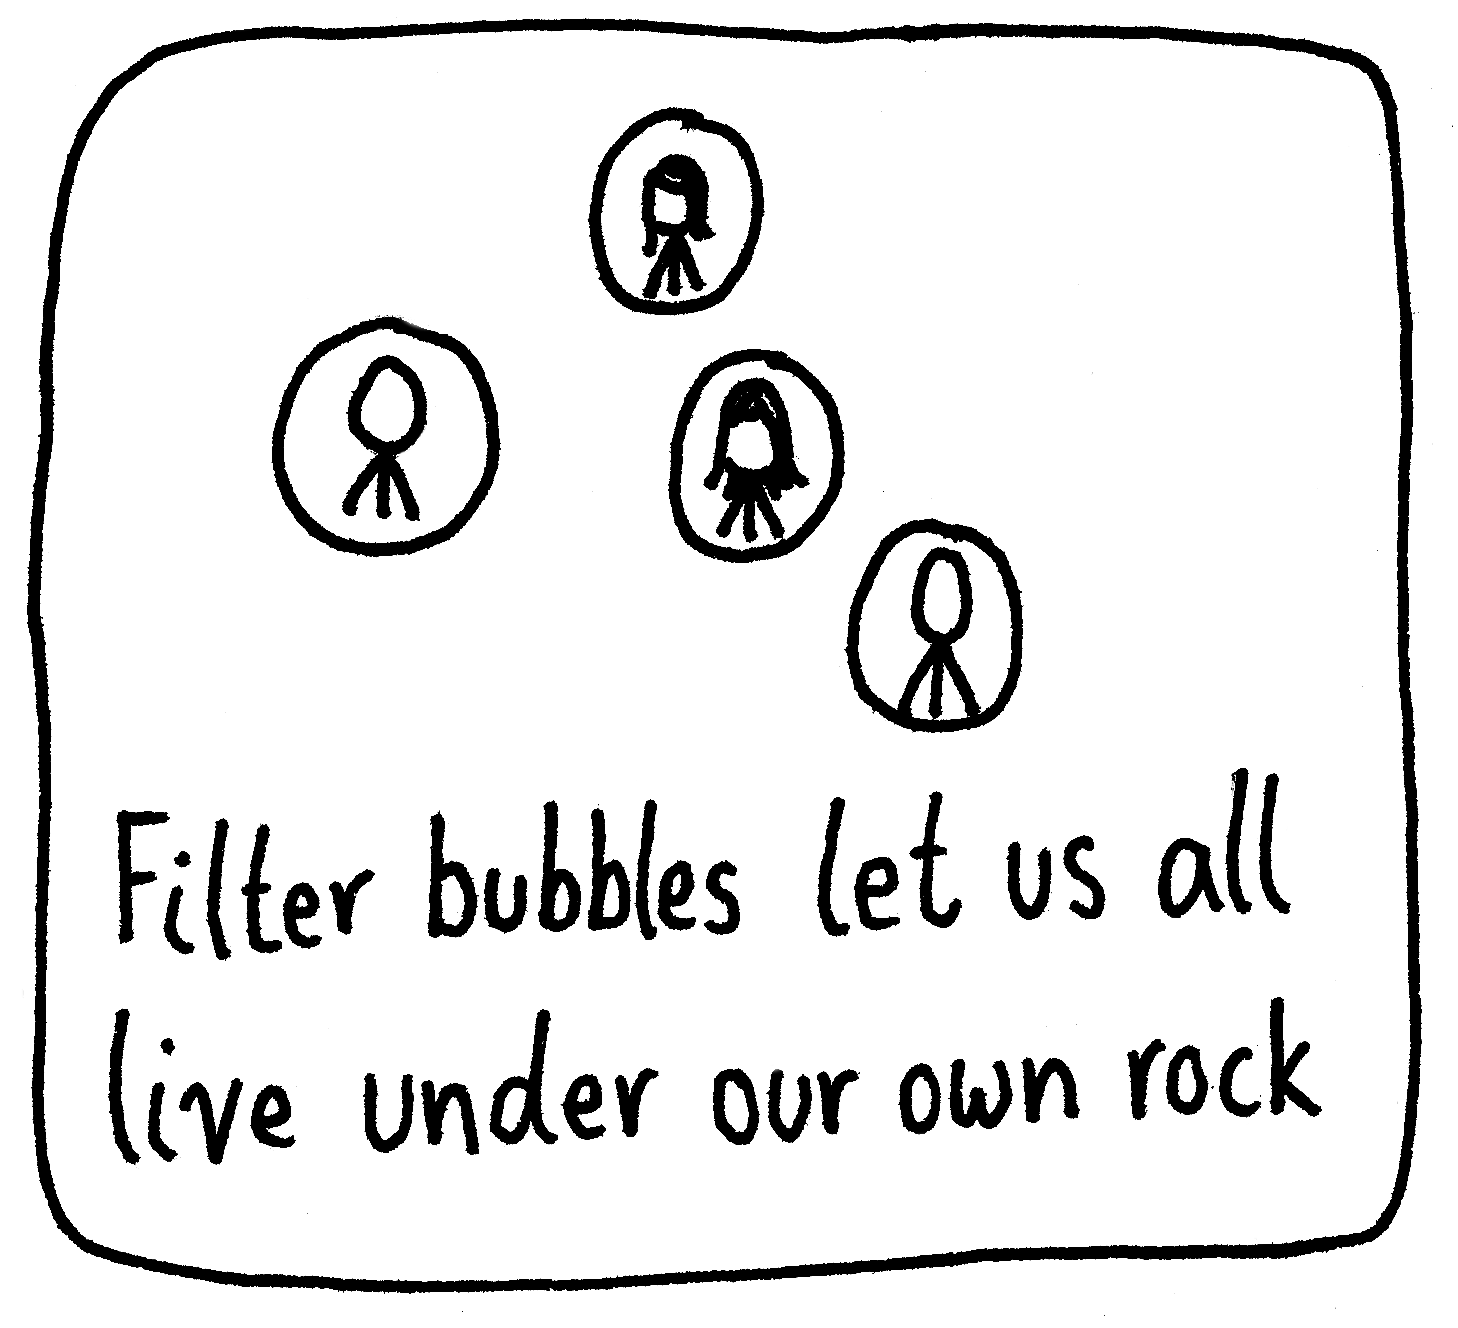
“Wait, how have you not heard of X?!” is a question that you can find people asking for basically any X.
26 Jun 2023Textbook Knowledge

In other words: Do spend some time outside the boundaries of your textbook.
23 Jun 2023
Cyborg
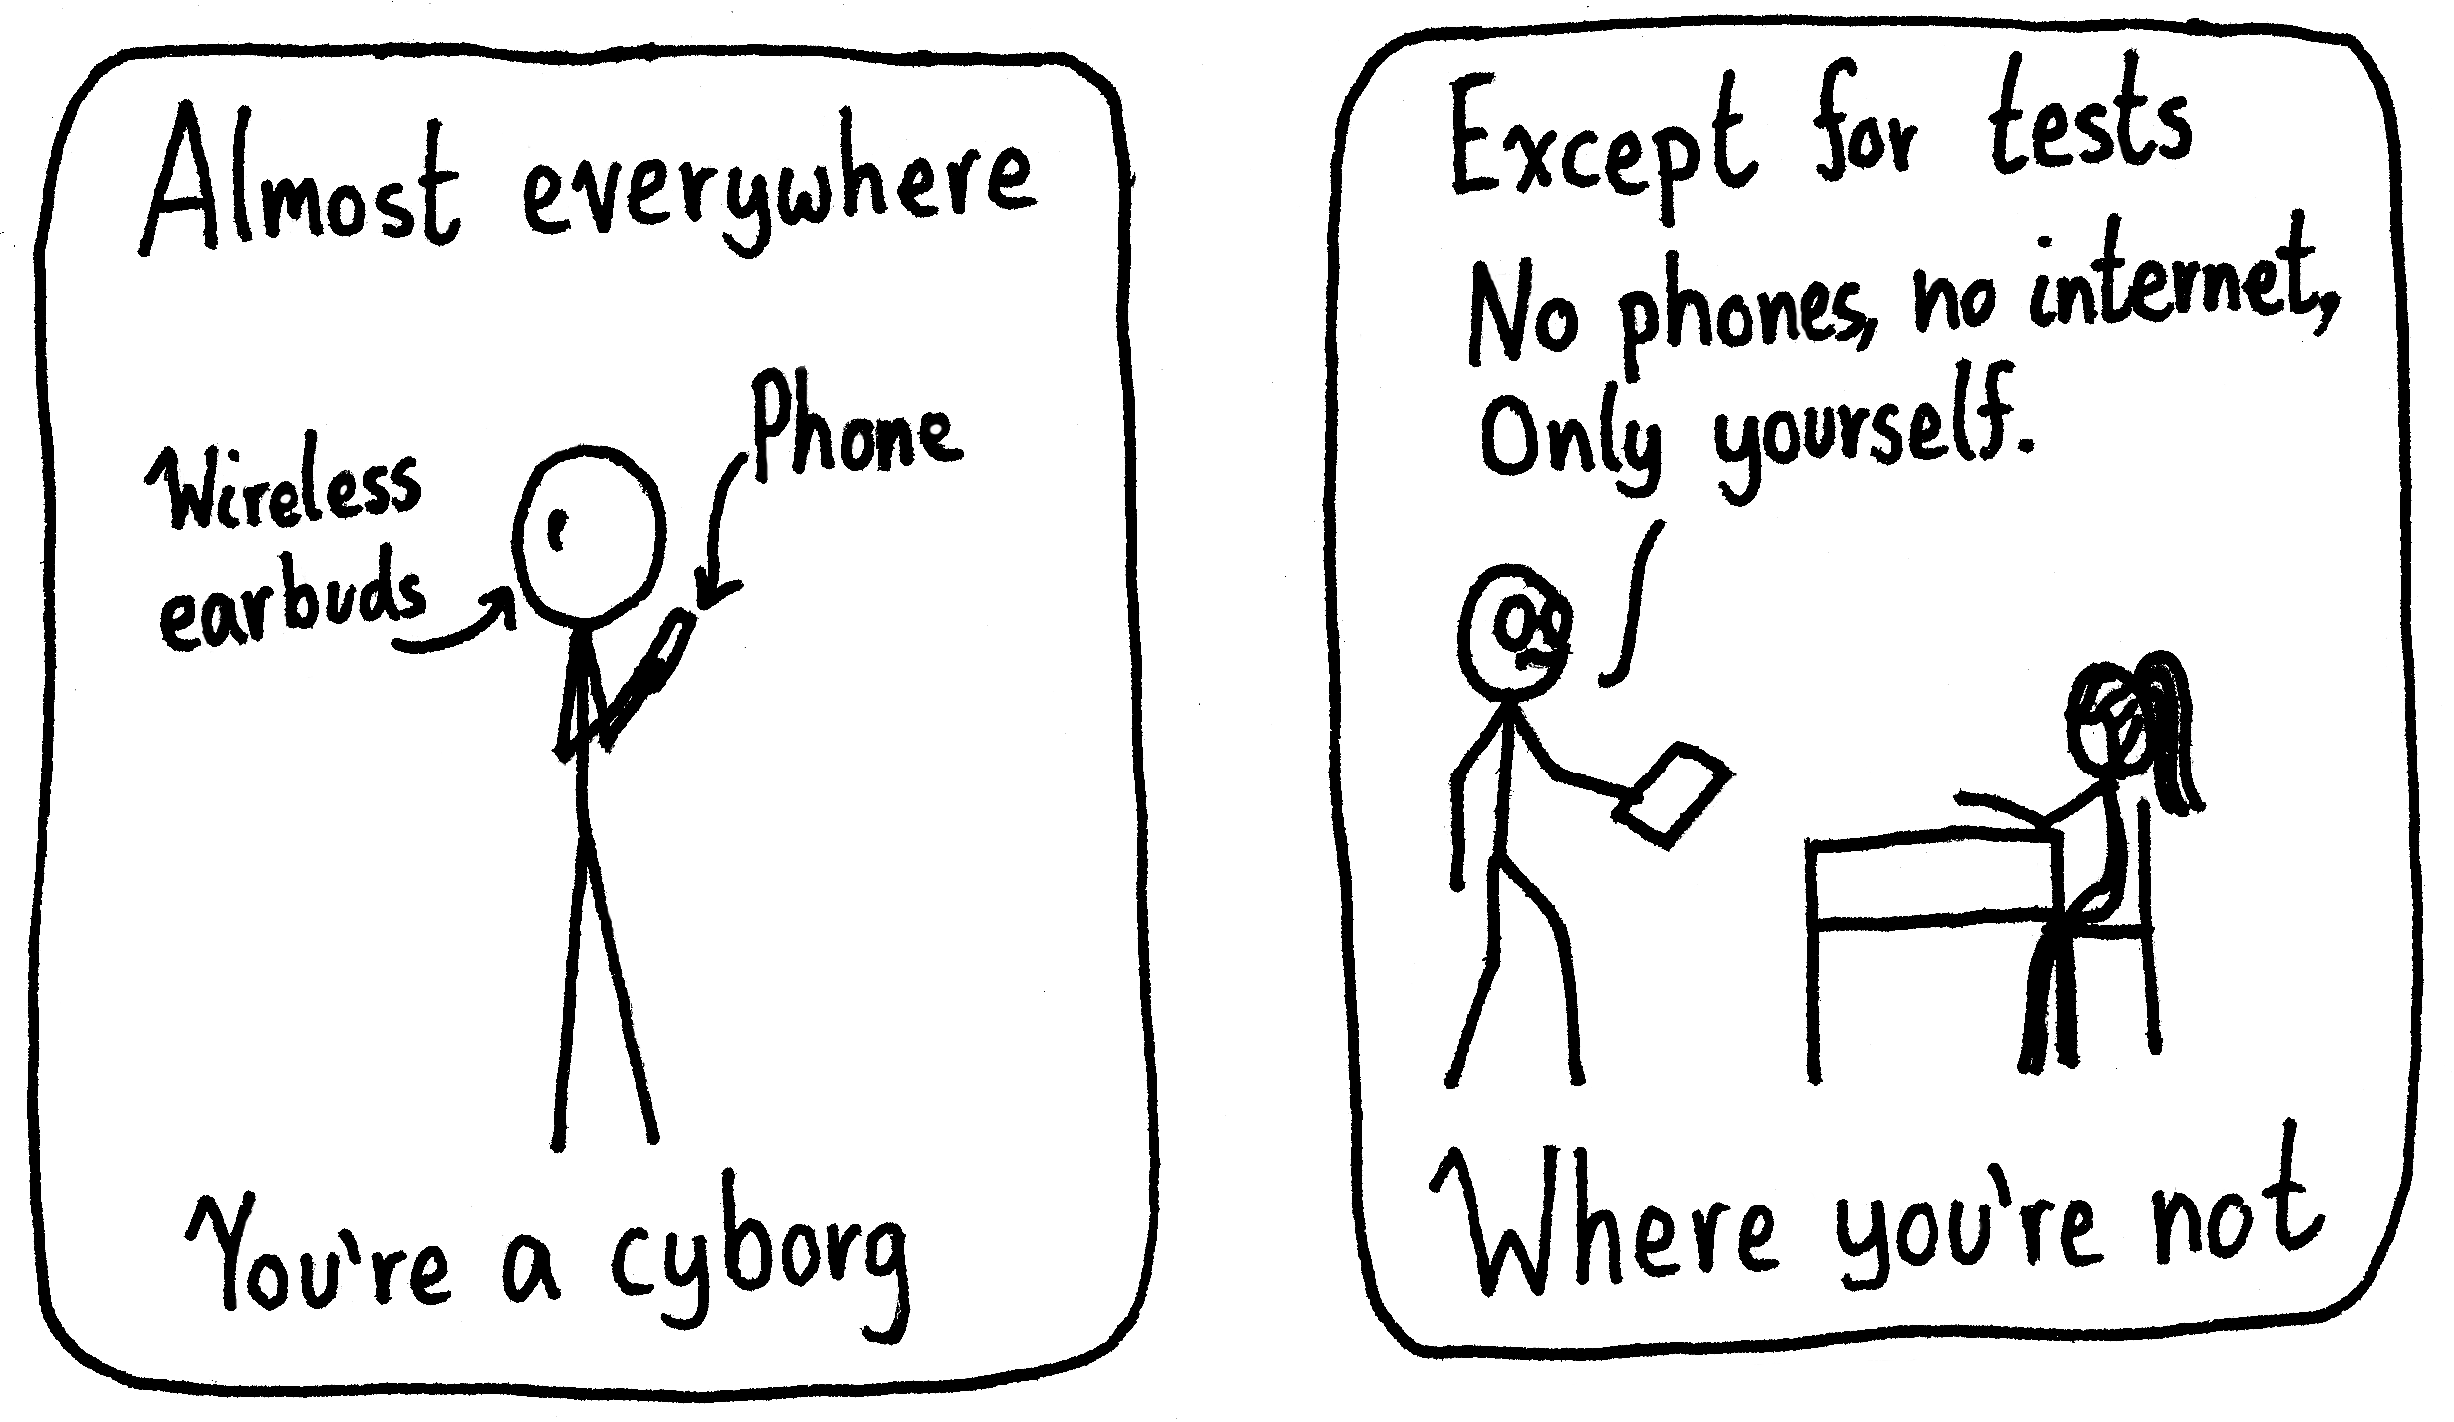
In the future, there will be a whole “decontamination procedure” to rid students of augmentations before they take tests.
19 Jun 2023