 Comics about mathematics, science, and the student life.

Healthy Identity
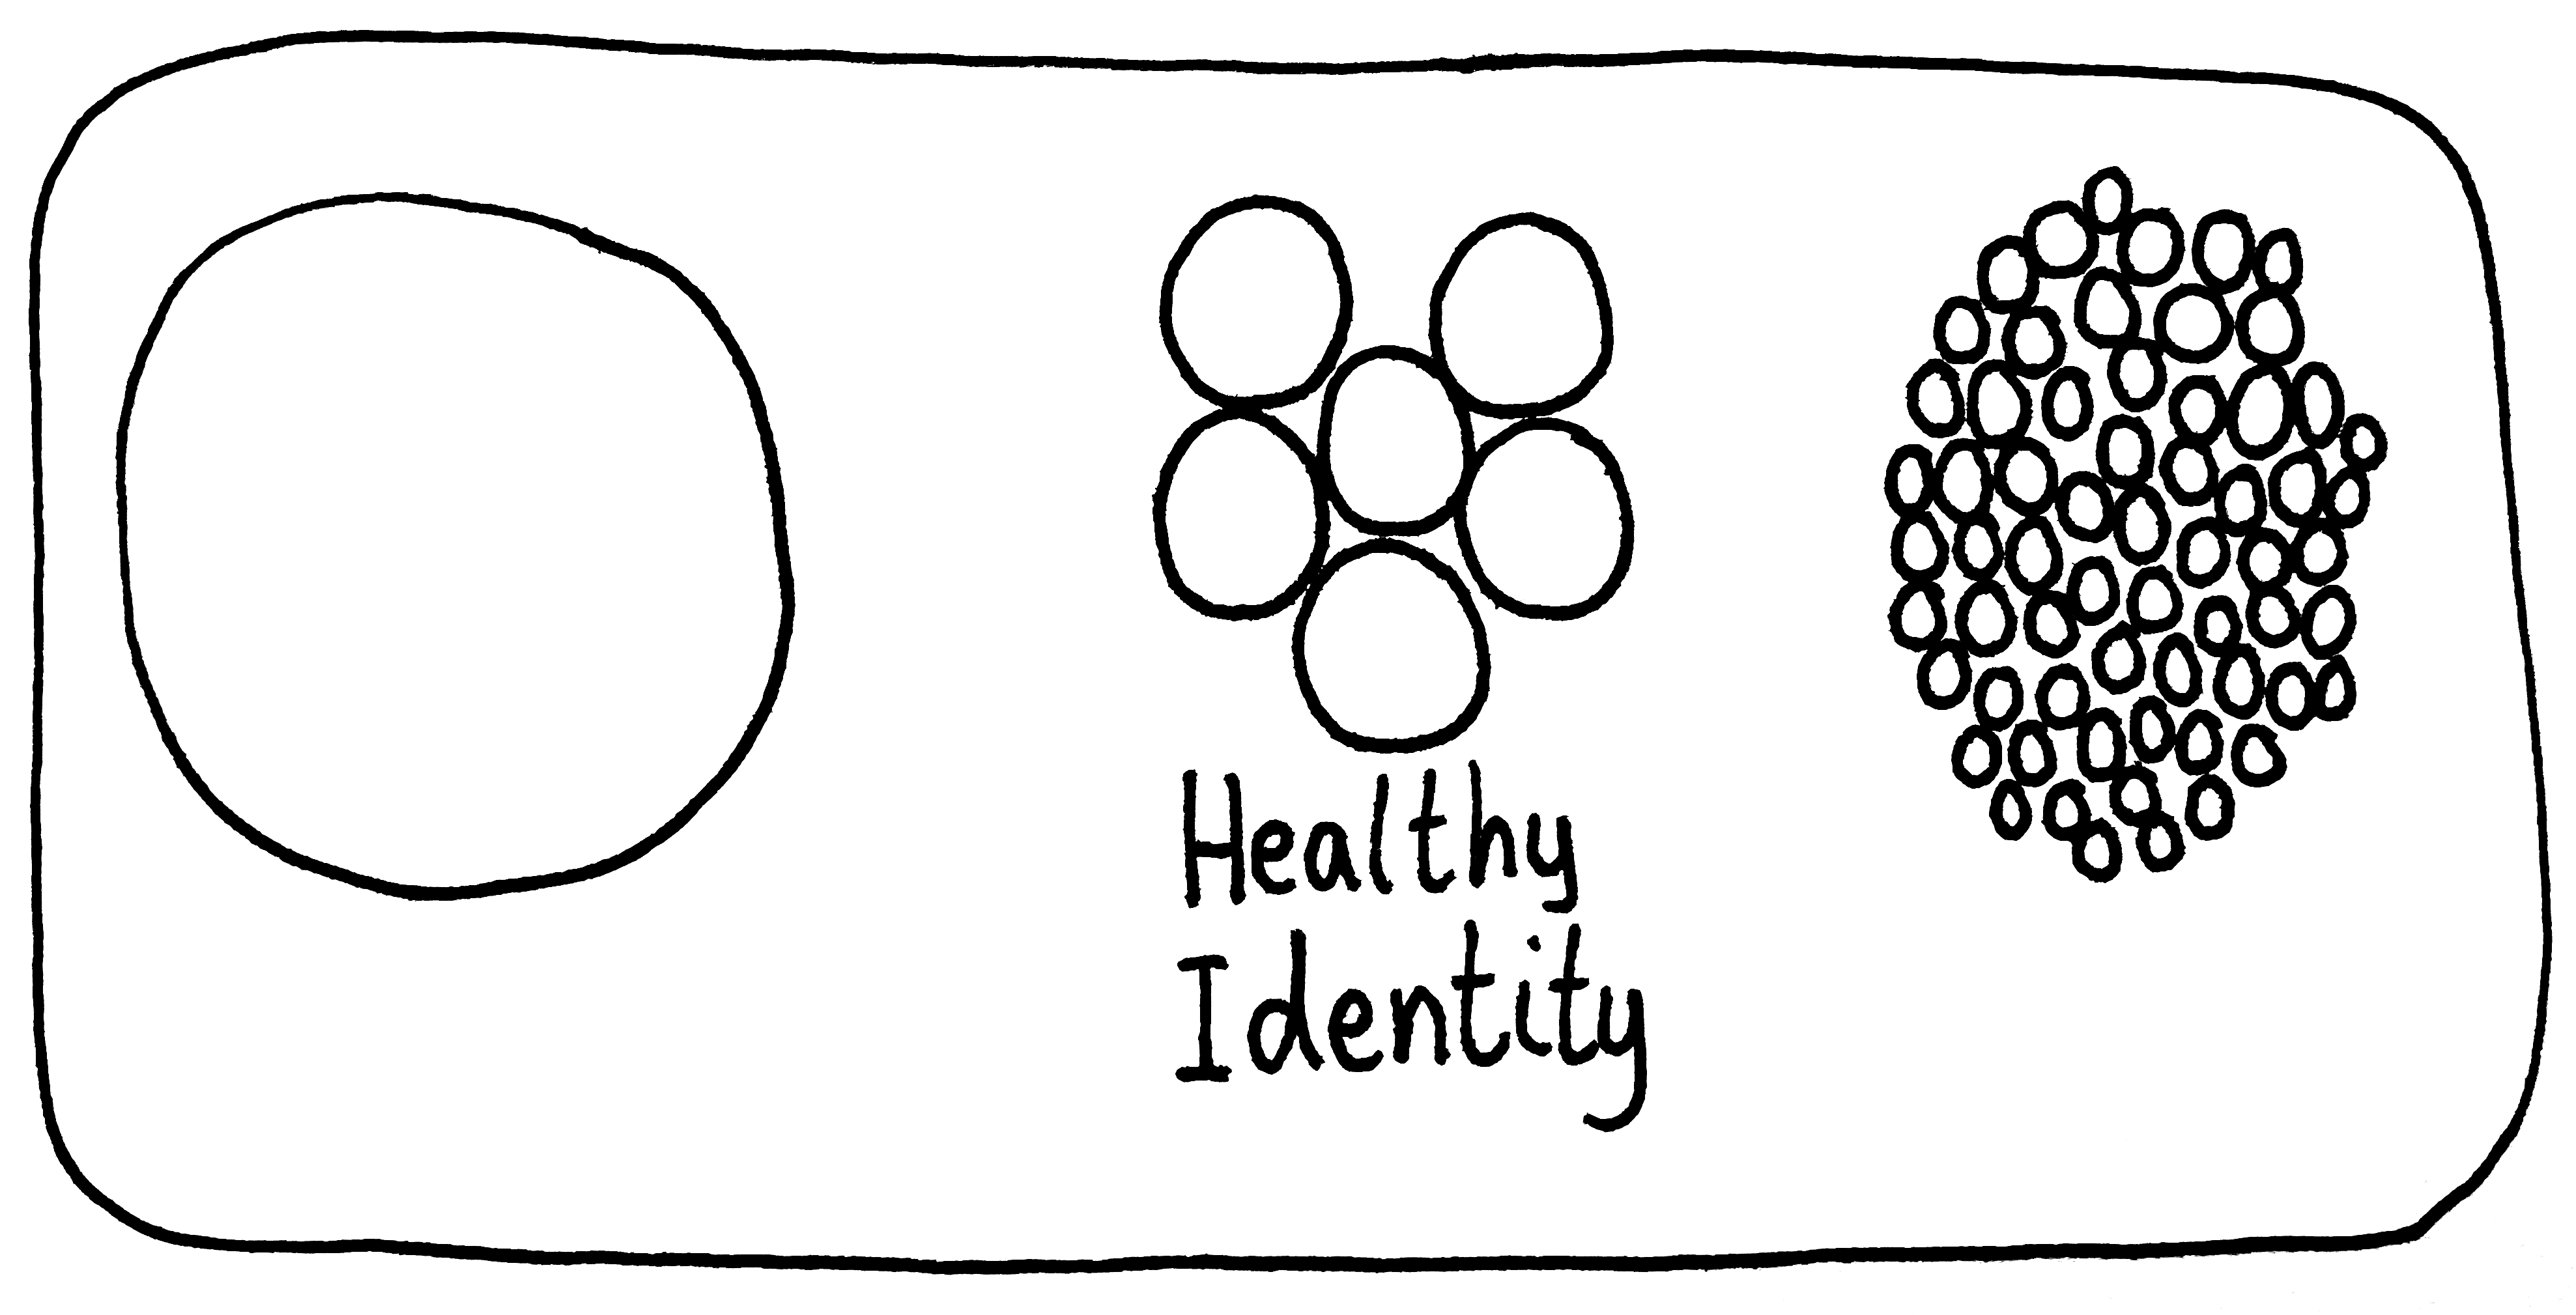
Honestly, six parts might be pushing it, but you definitely need more than one!
19 Jun 2024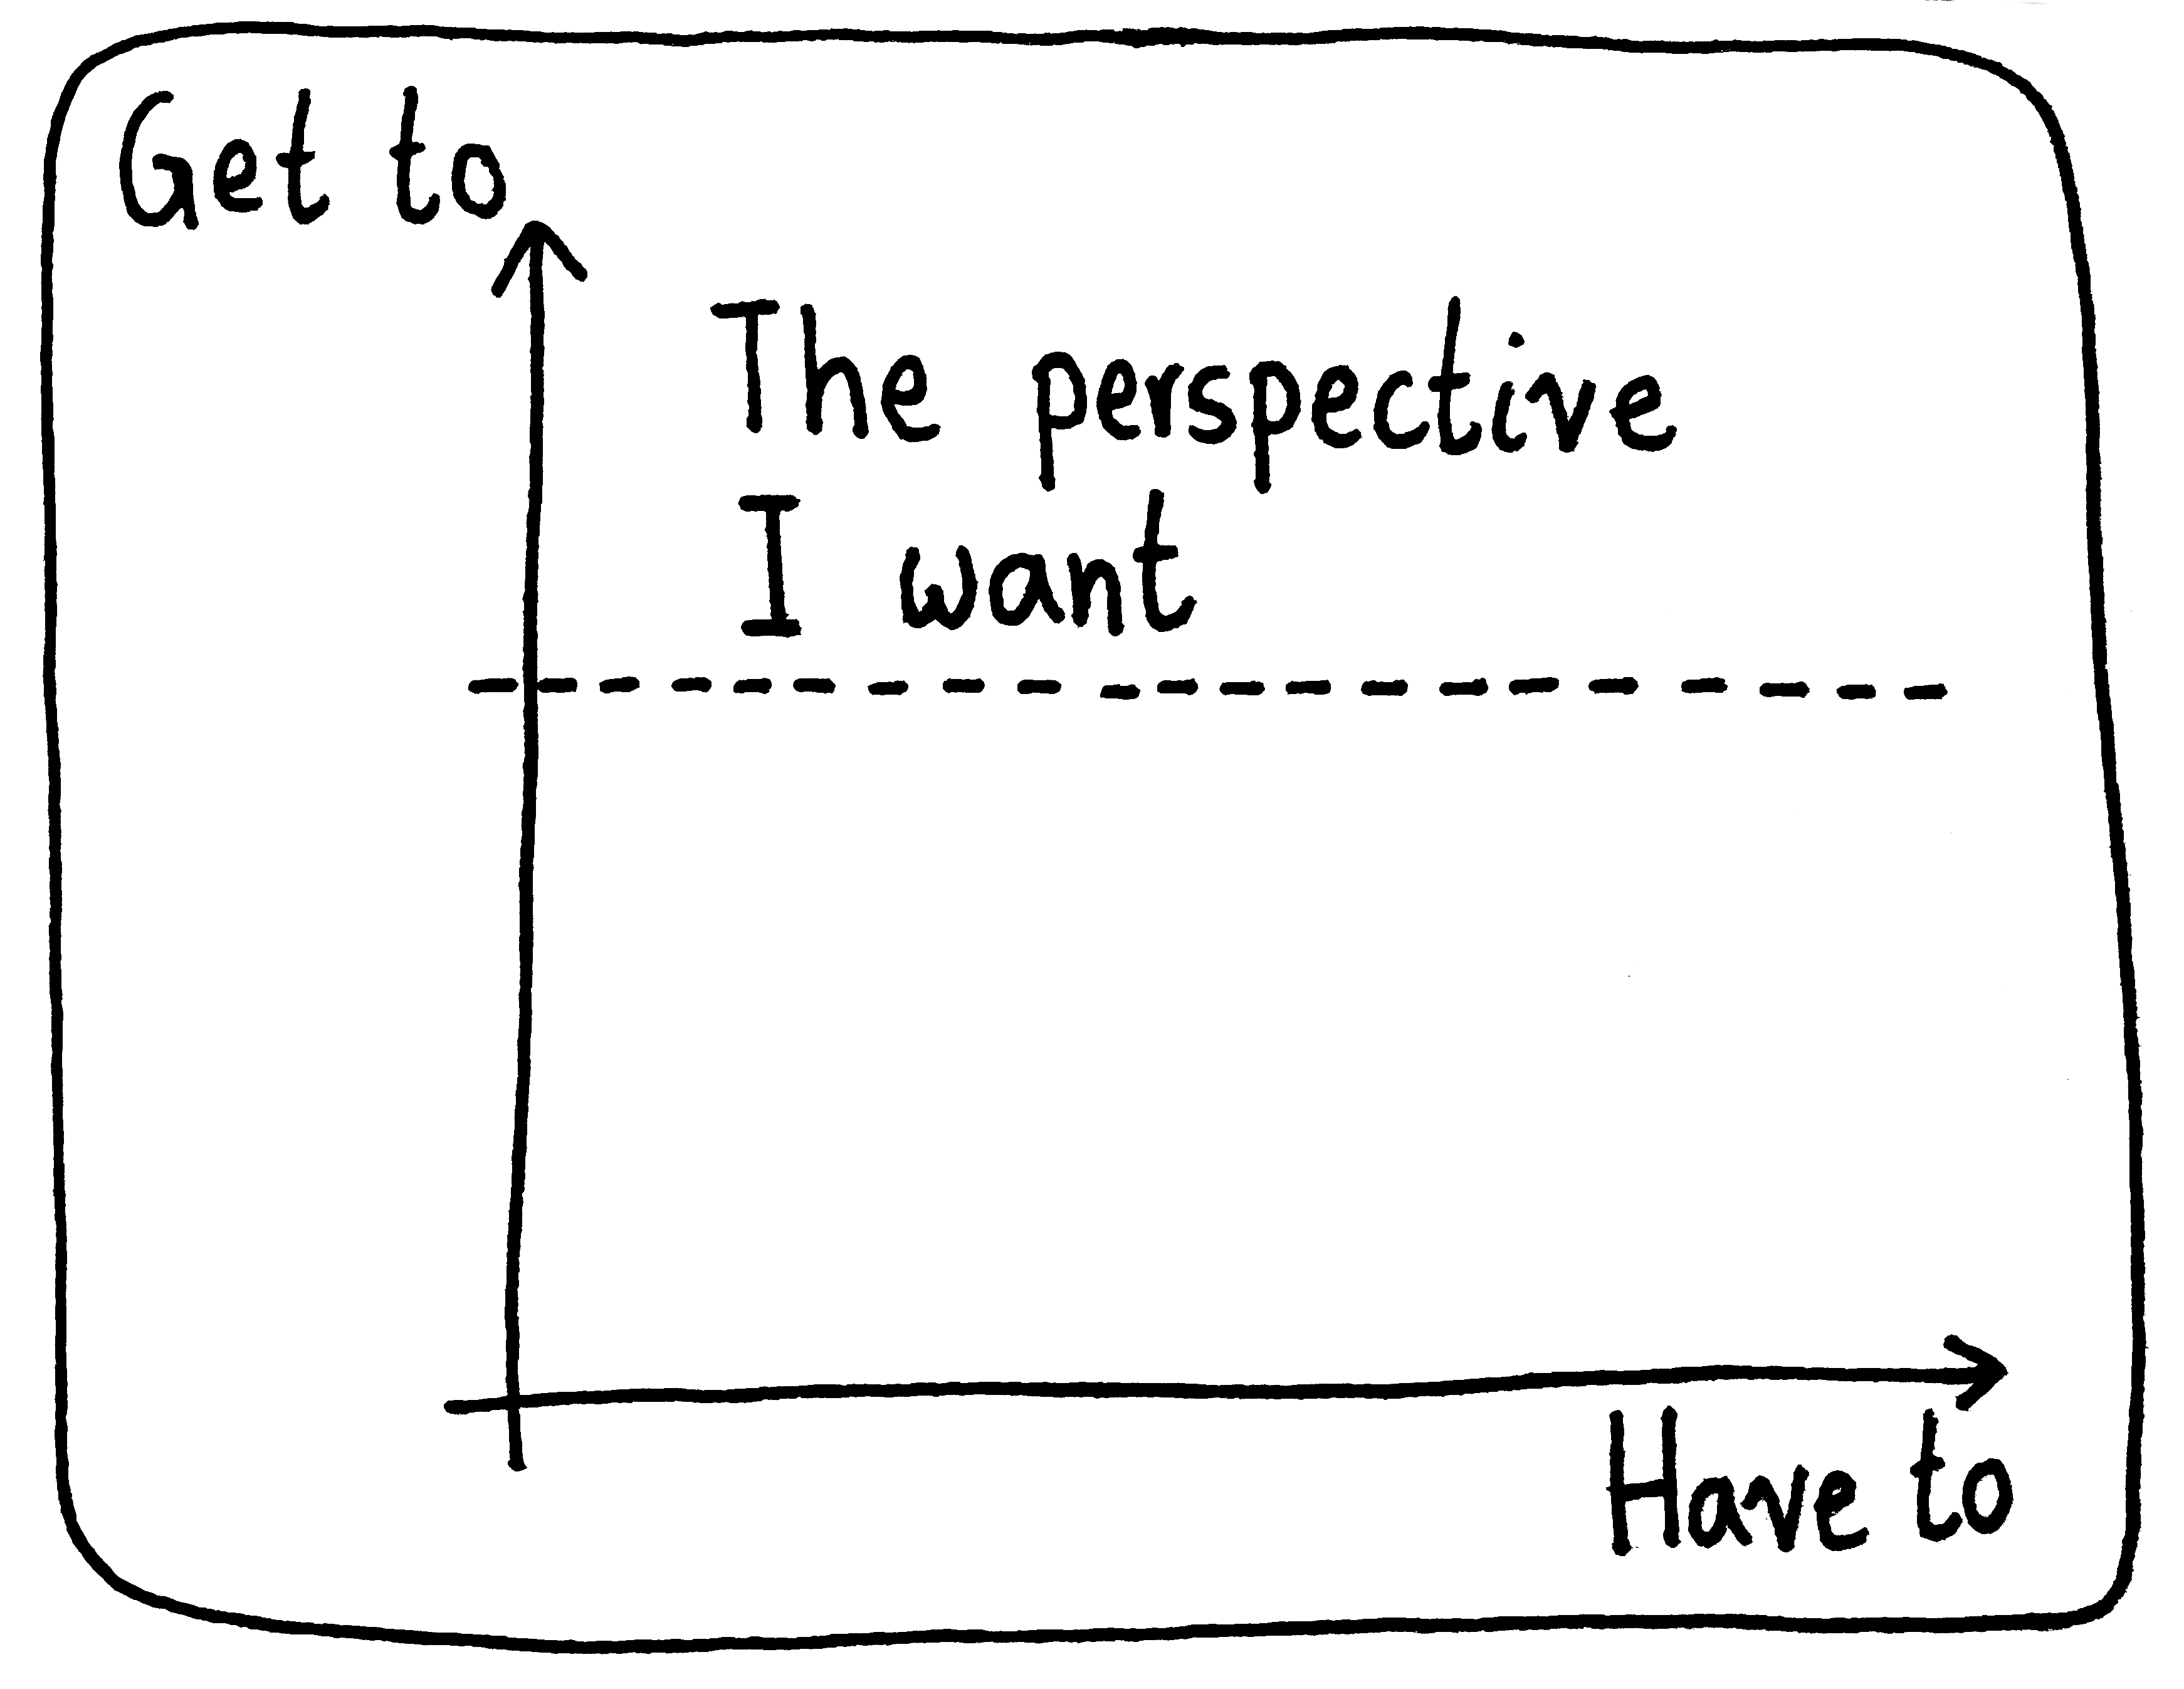
Memorize

I used to hate it when, after either myself or a classmate complained about a lack of memory aids for a test, my mathematics professor would say, “Just rederive anything you don’t know! Then you don’t have to memorize it.” While I think they didn’t always appreciate the need for speed during tests, they were definitely on the right track for learning mathematics in general.
29 May 2024

Careful Opportunities

Which is why finding work that’s aligned with what you somewhat enjoy is so important.
08 May 2024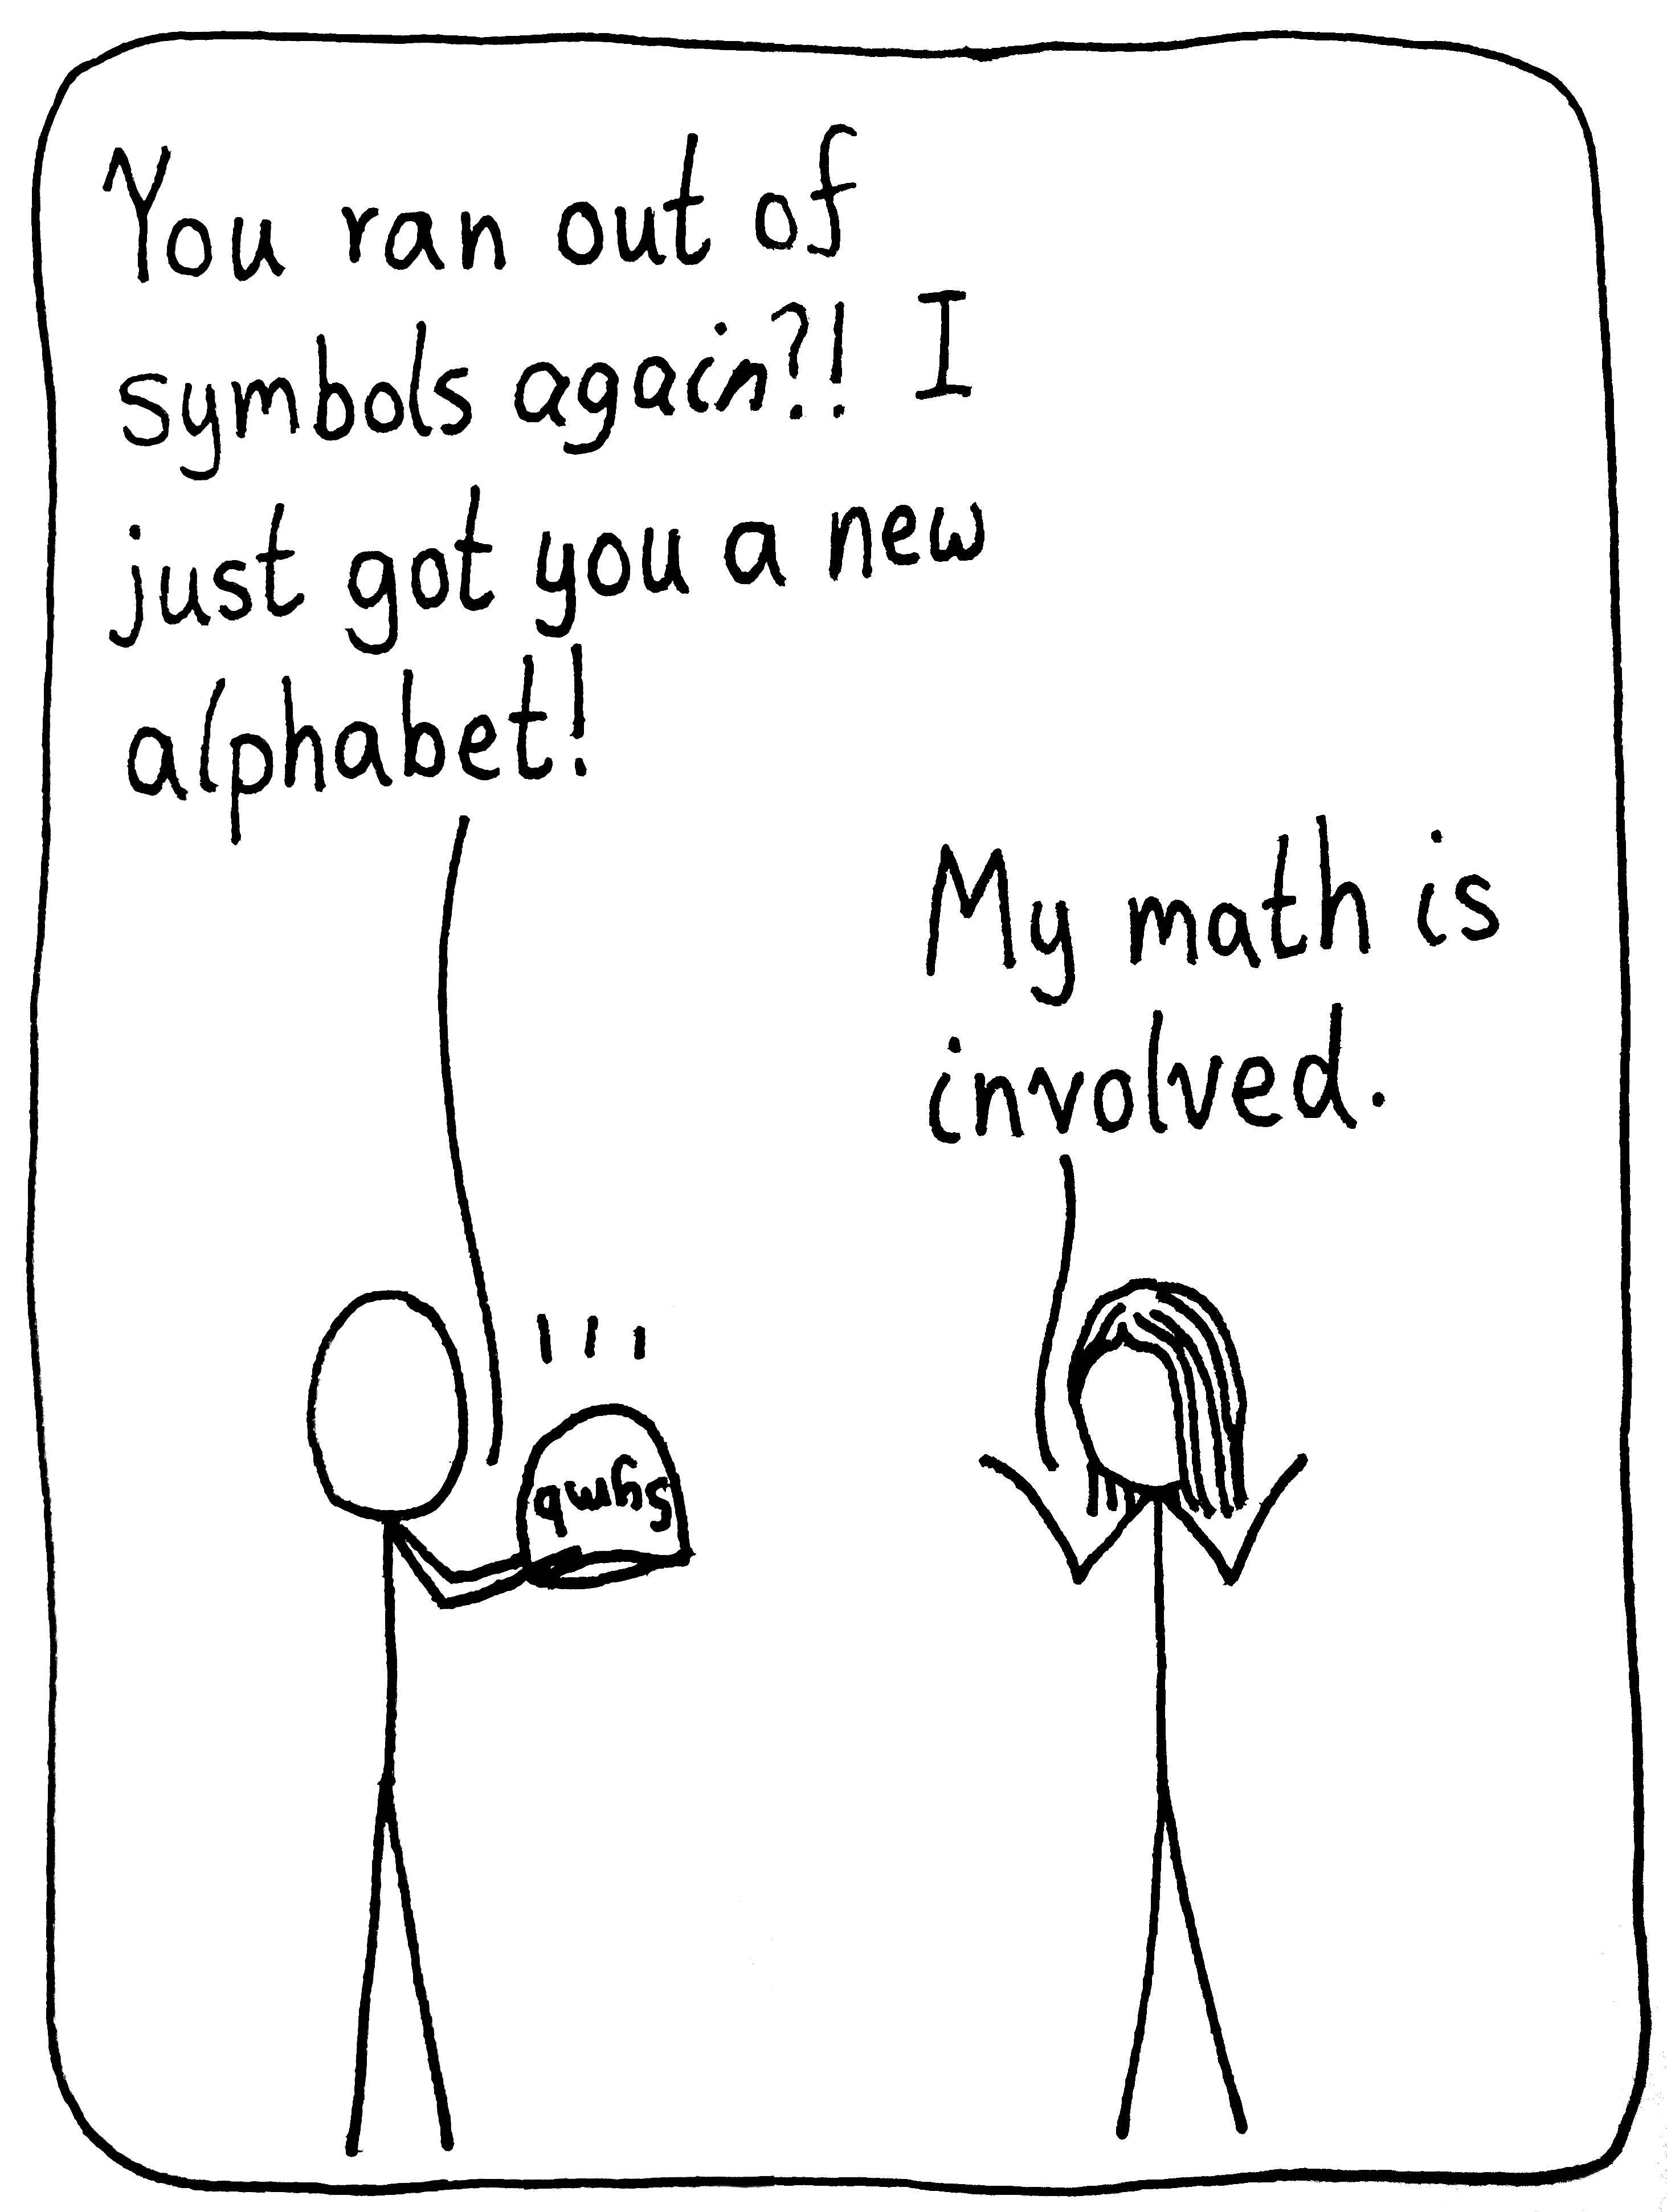
Utilize

I spent the whole afternoon putting these posters up around town, and then somebody brought them all back to me the next day. What’s up with that?
24 Apr 2024