 Comics about mathematics, science, and the student life.


Interdisciplinary
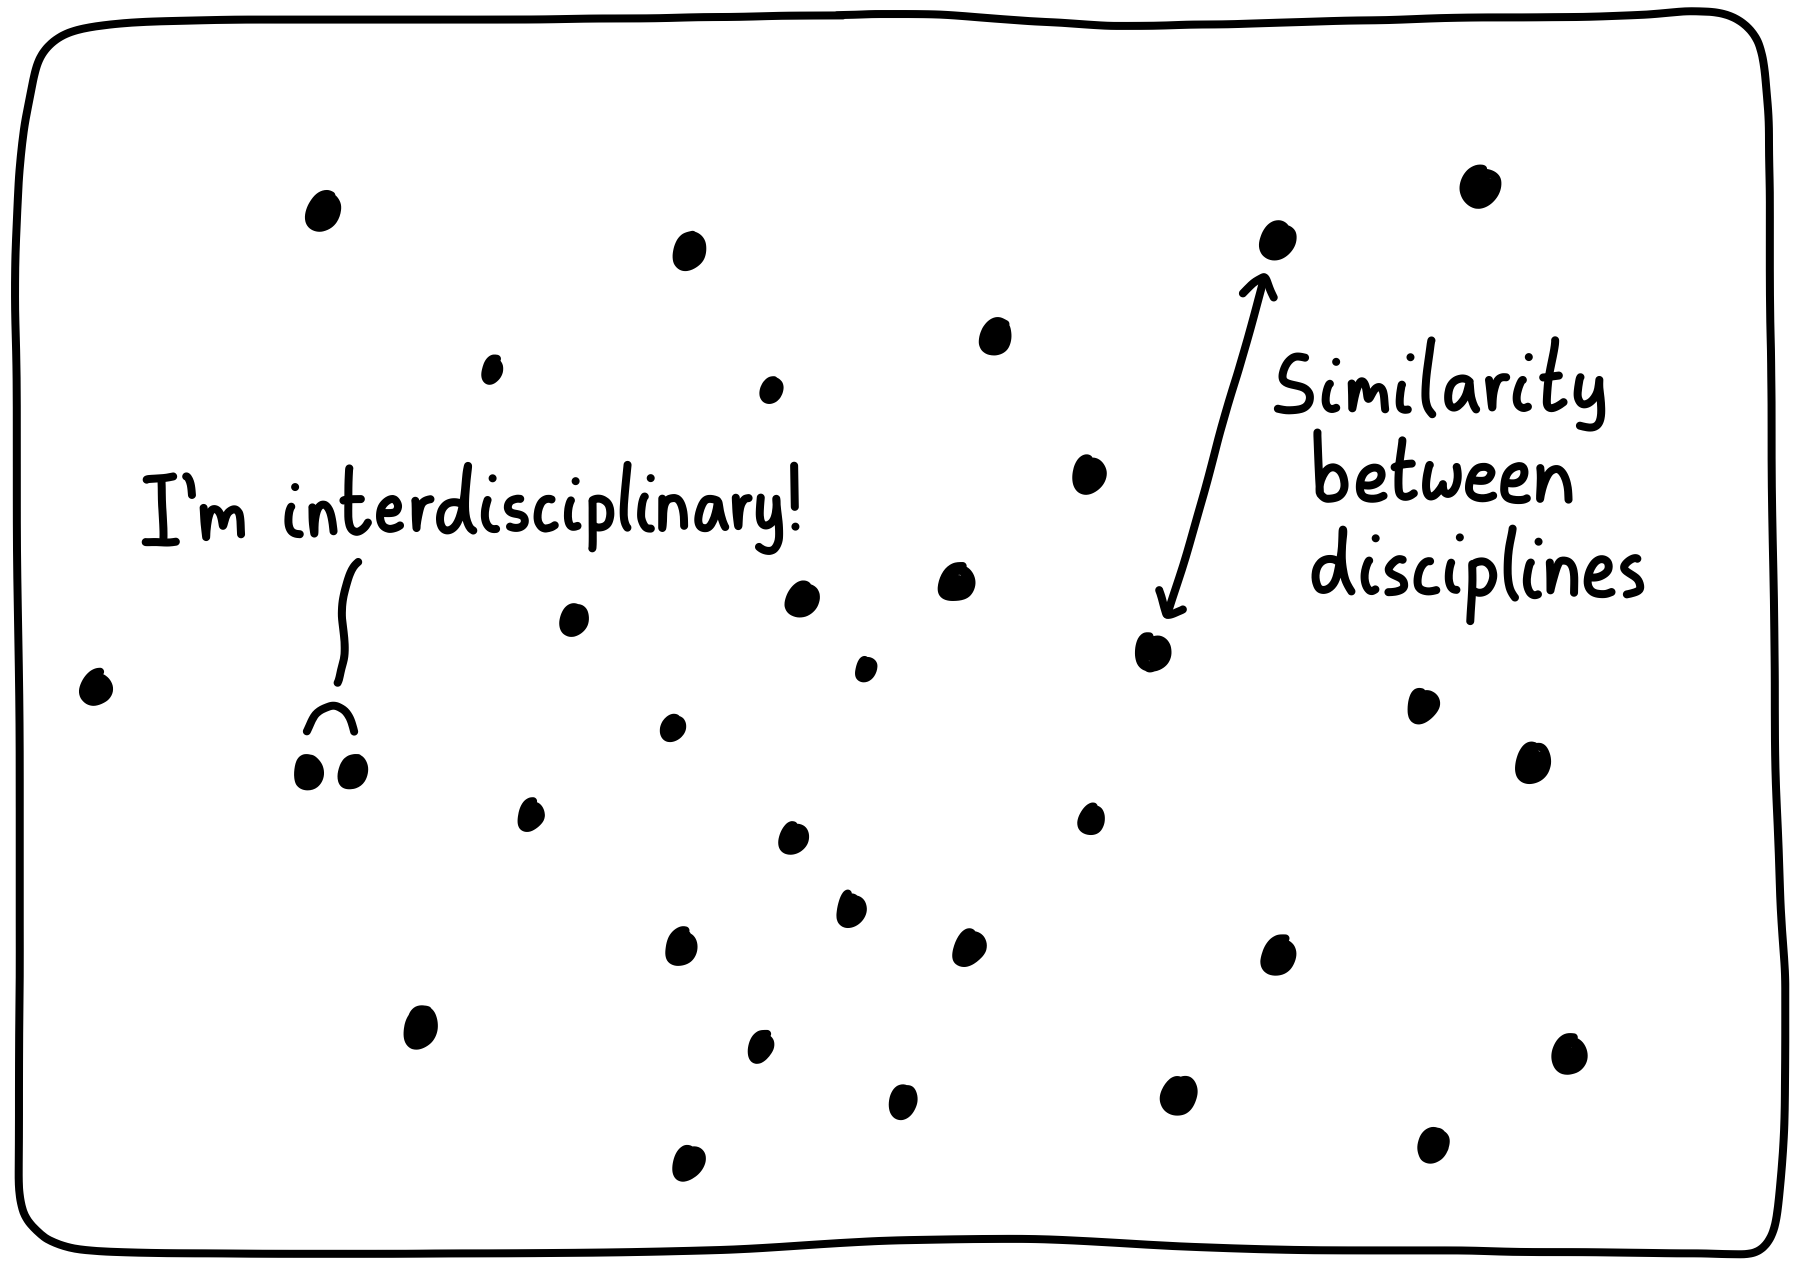
The trick is to keep splitting up your discipline into smaller and smaller pieces, until you can claim your work goes through a bunch of different areas.
24 Jan 2022Elevator Pitch
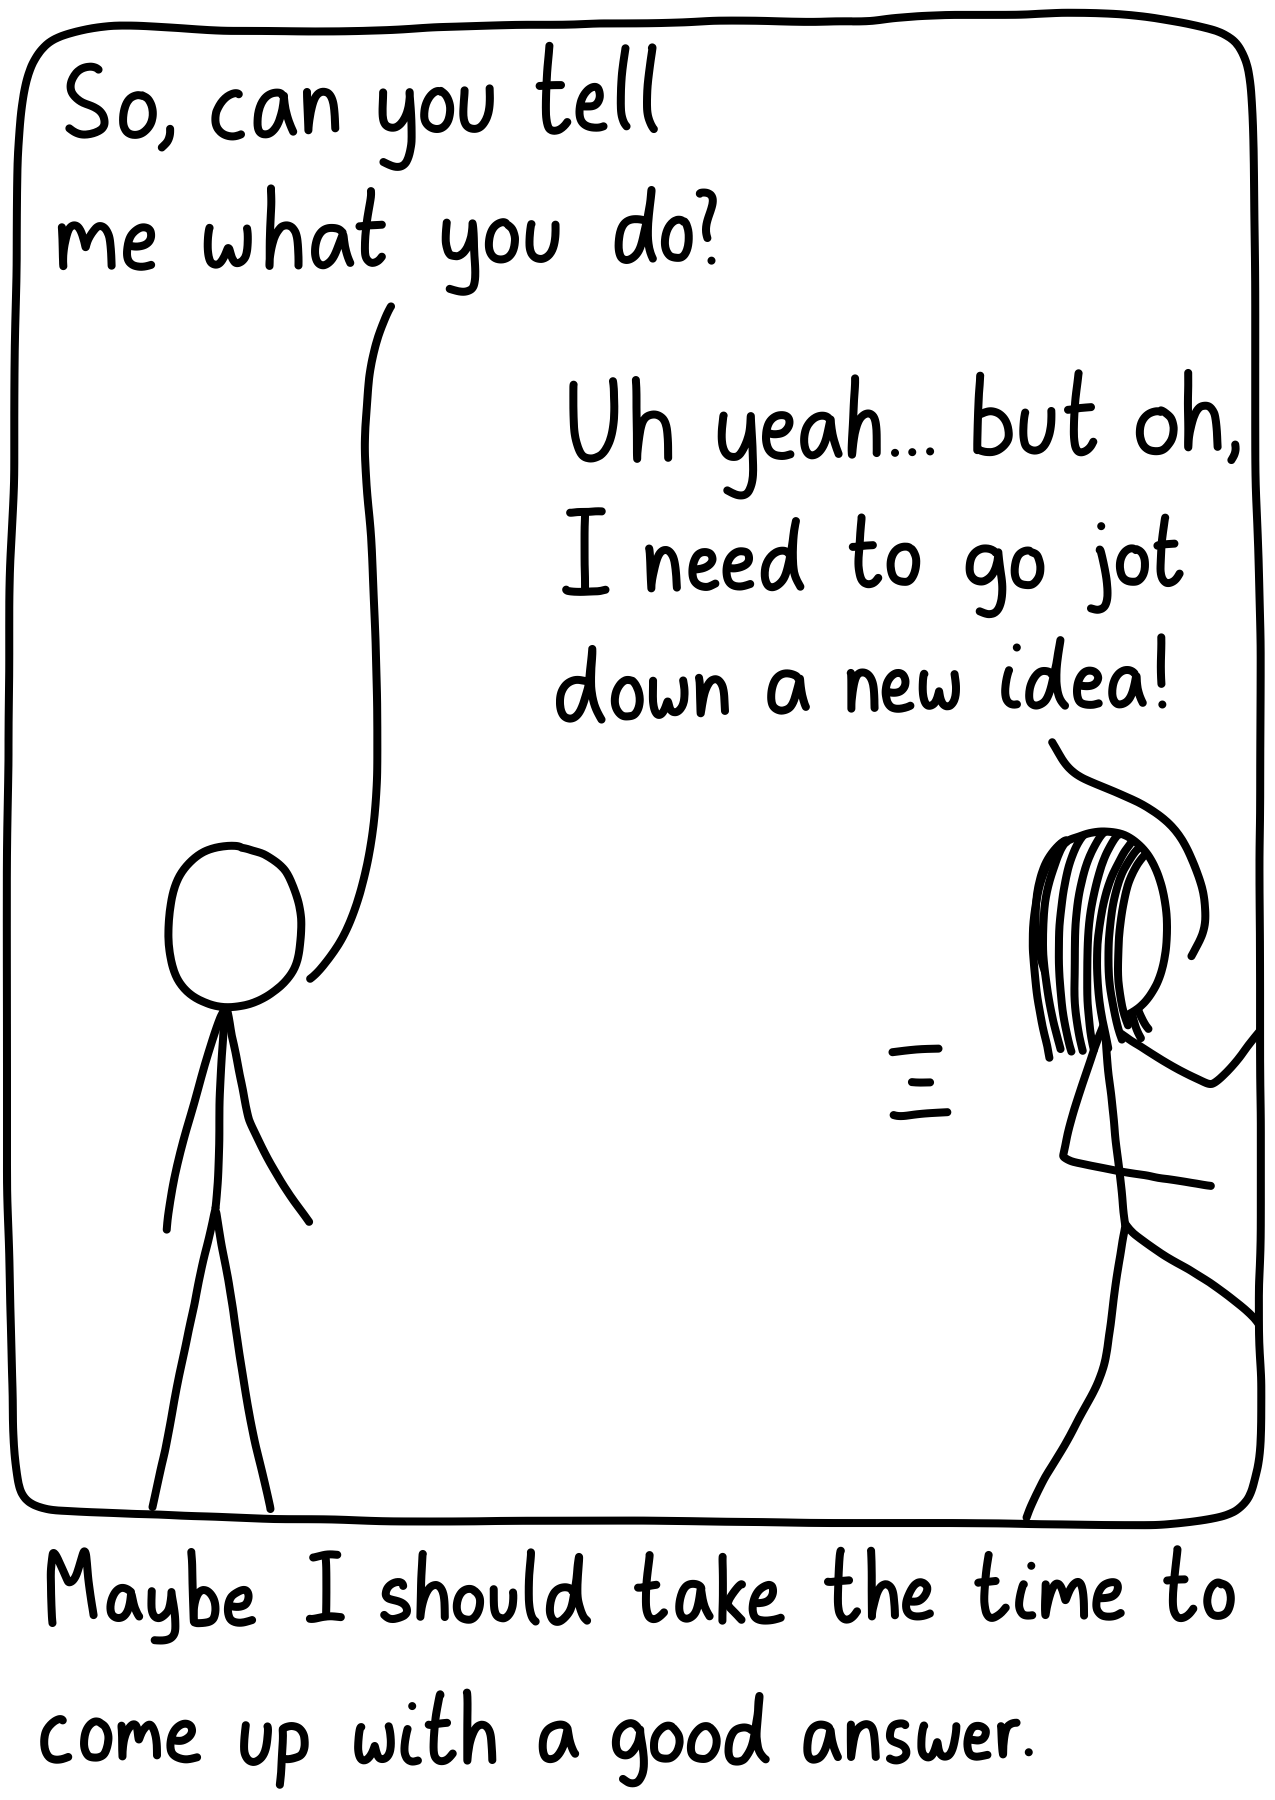
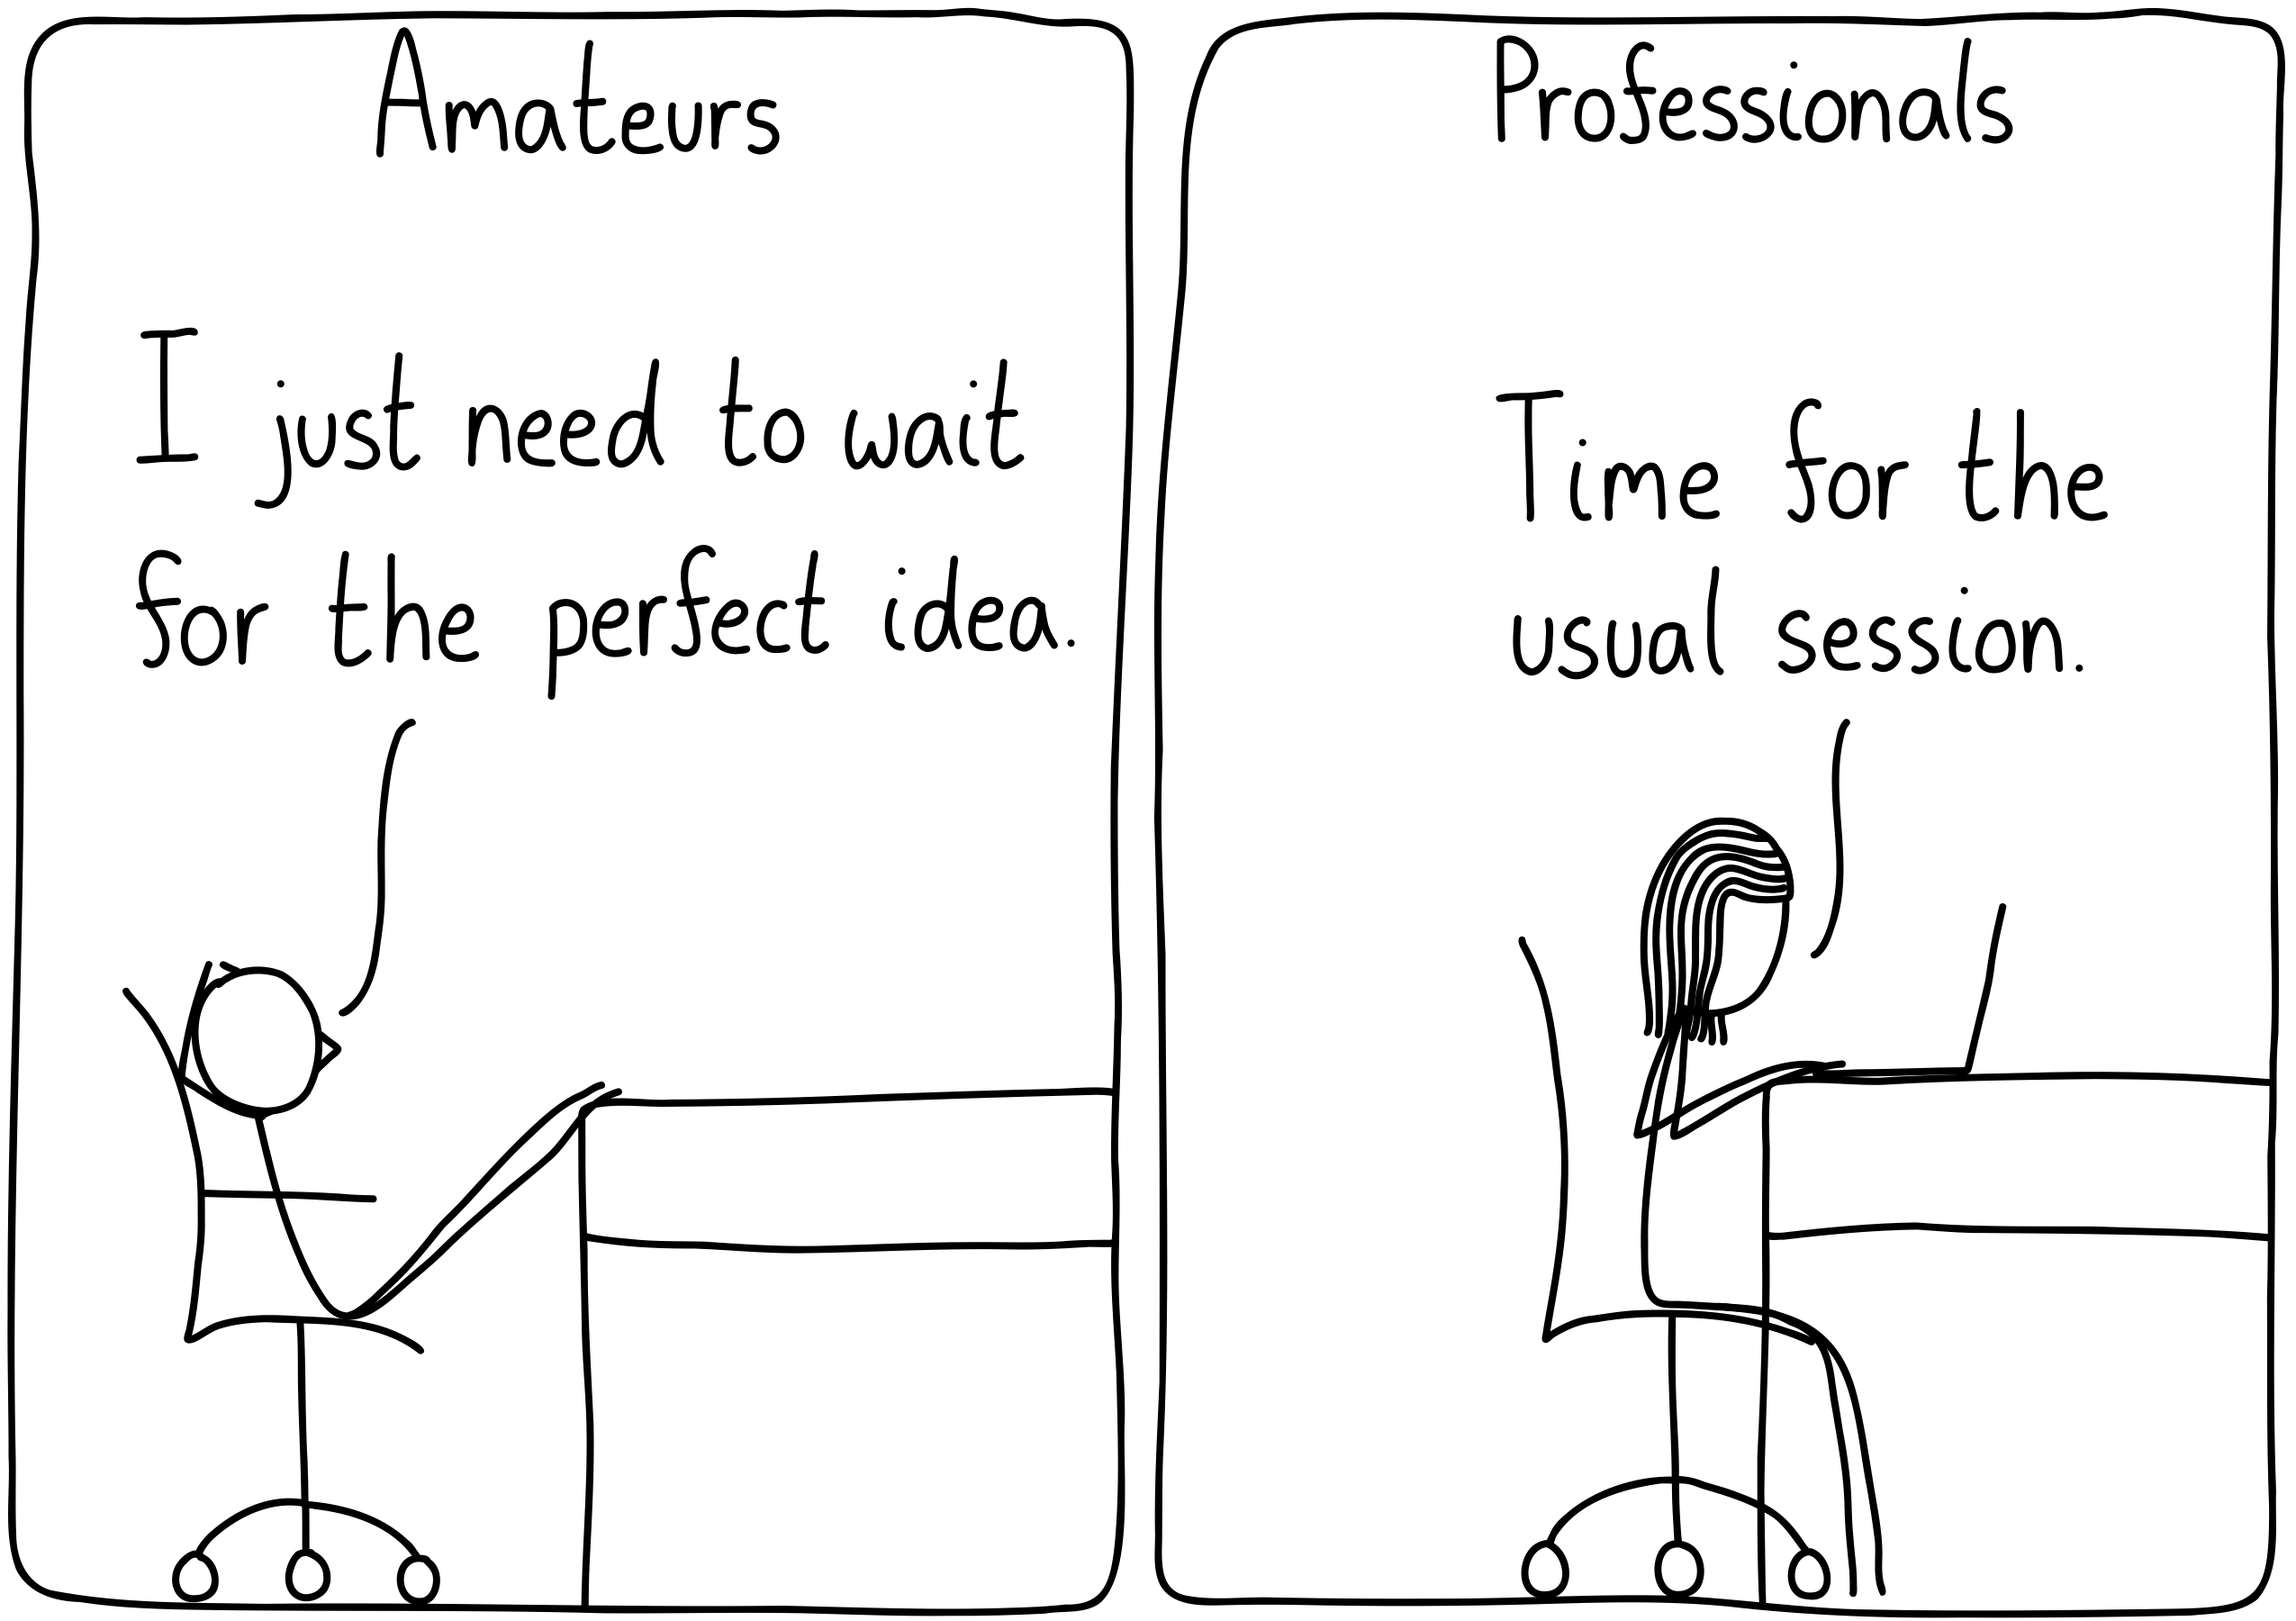
“Do you mean to tell me you’ve spent years working on this, but you don’t know how to explain it to me?!”
“Oh no, I can do it…I’ll let you know this afternoon.” (Proceeds to spend that time frantically searching for a good way to communicate the idea.)
21 Jan 2022