Comics about mathematics, science, and the student life.

Hopebeat

A graph showing the "hopebeat" during research. It begins at a baseline, spikes up when we think, "This is a breakthrough!", hits a low when we realize, "Okay, maybe not", bounces back up just above the baseline when we find a new topic to get excited about, spikes when we think, "This will change the world!", crashes down again when we realize it won't work, and then repeats.

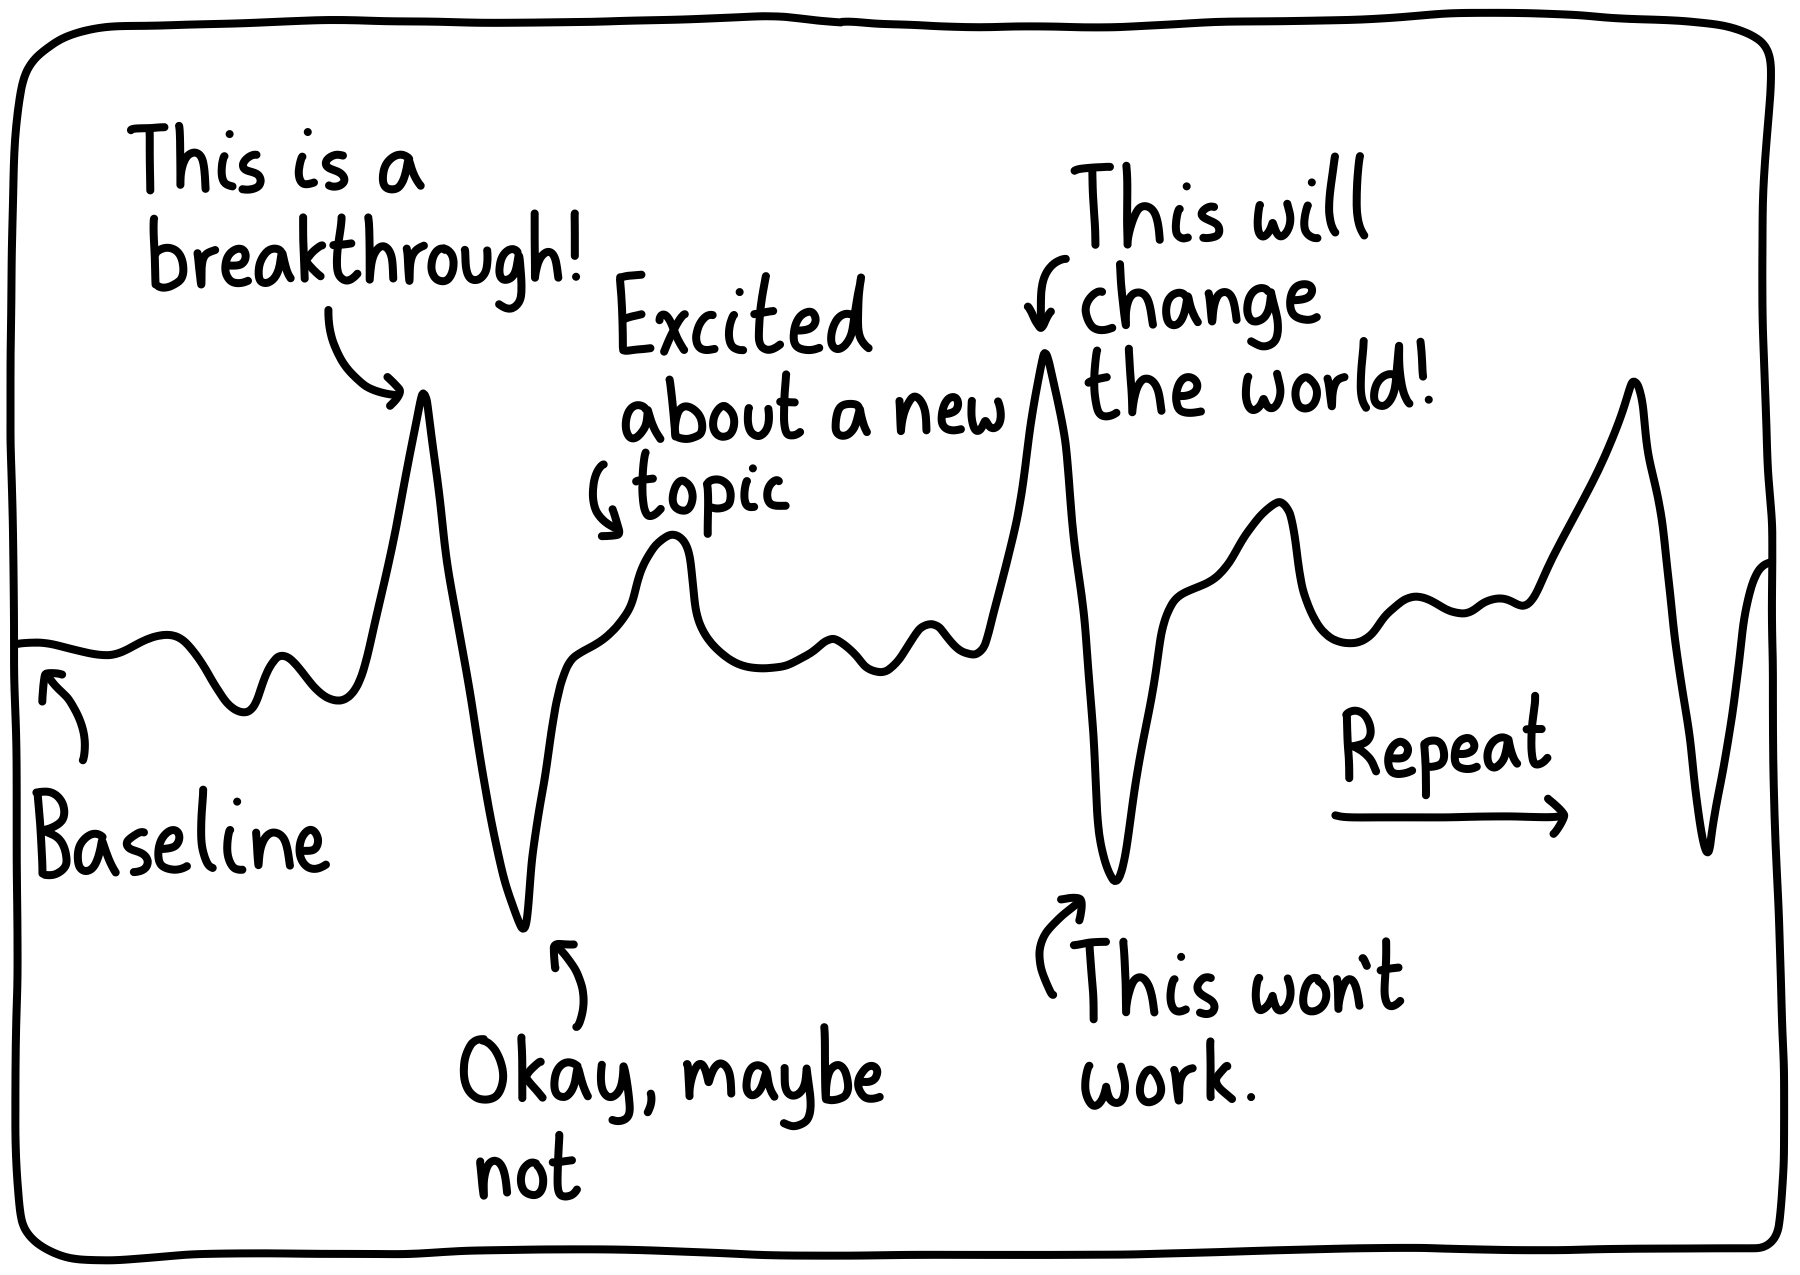
Note: Time between peaks is irregular and can grow to arbitrary durations.