 Comics about mathematics, science, and the student life.
Digging
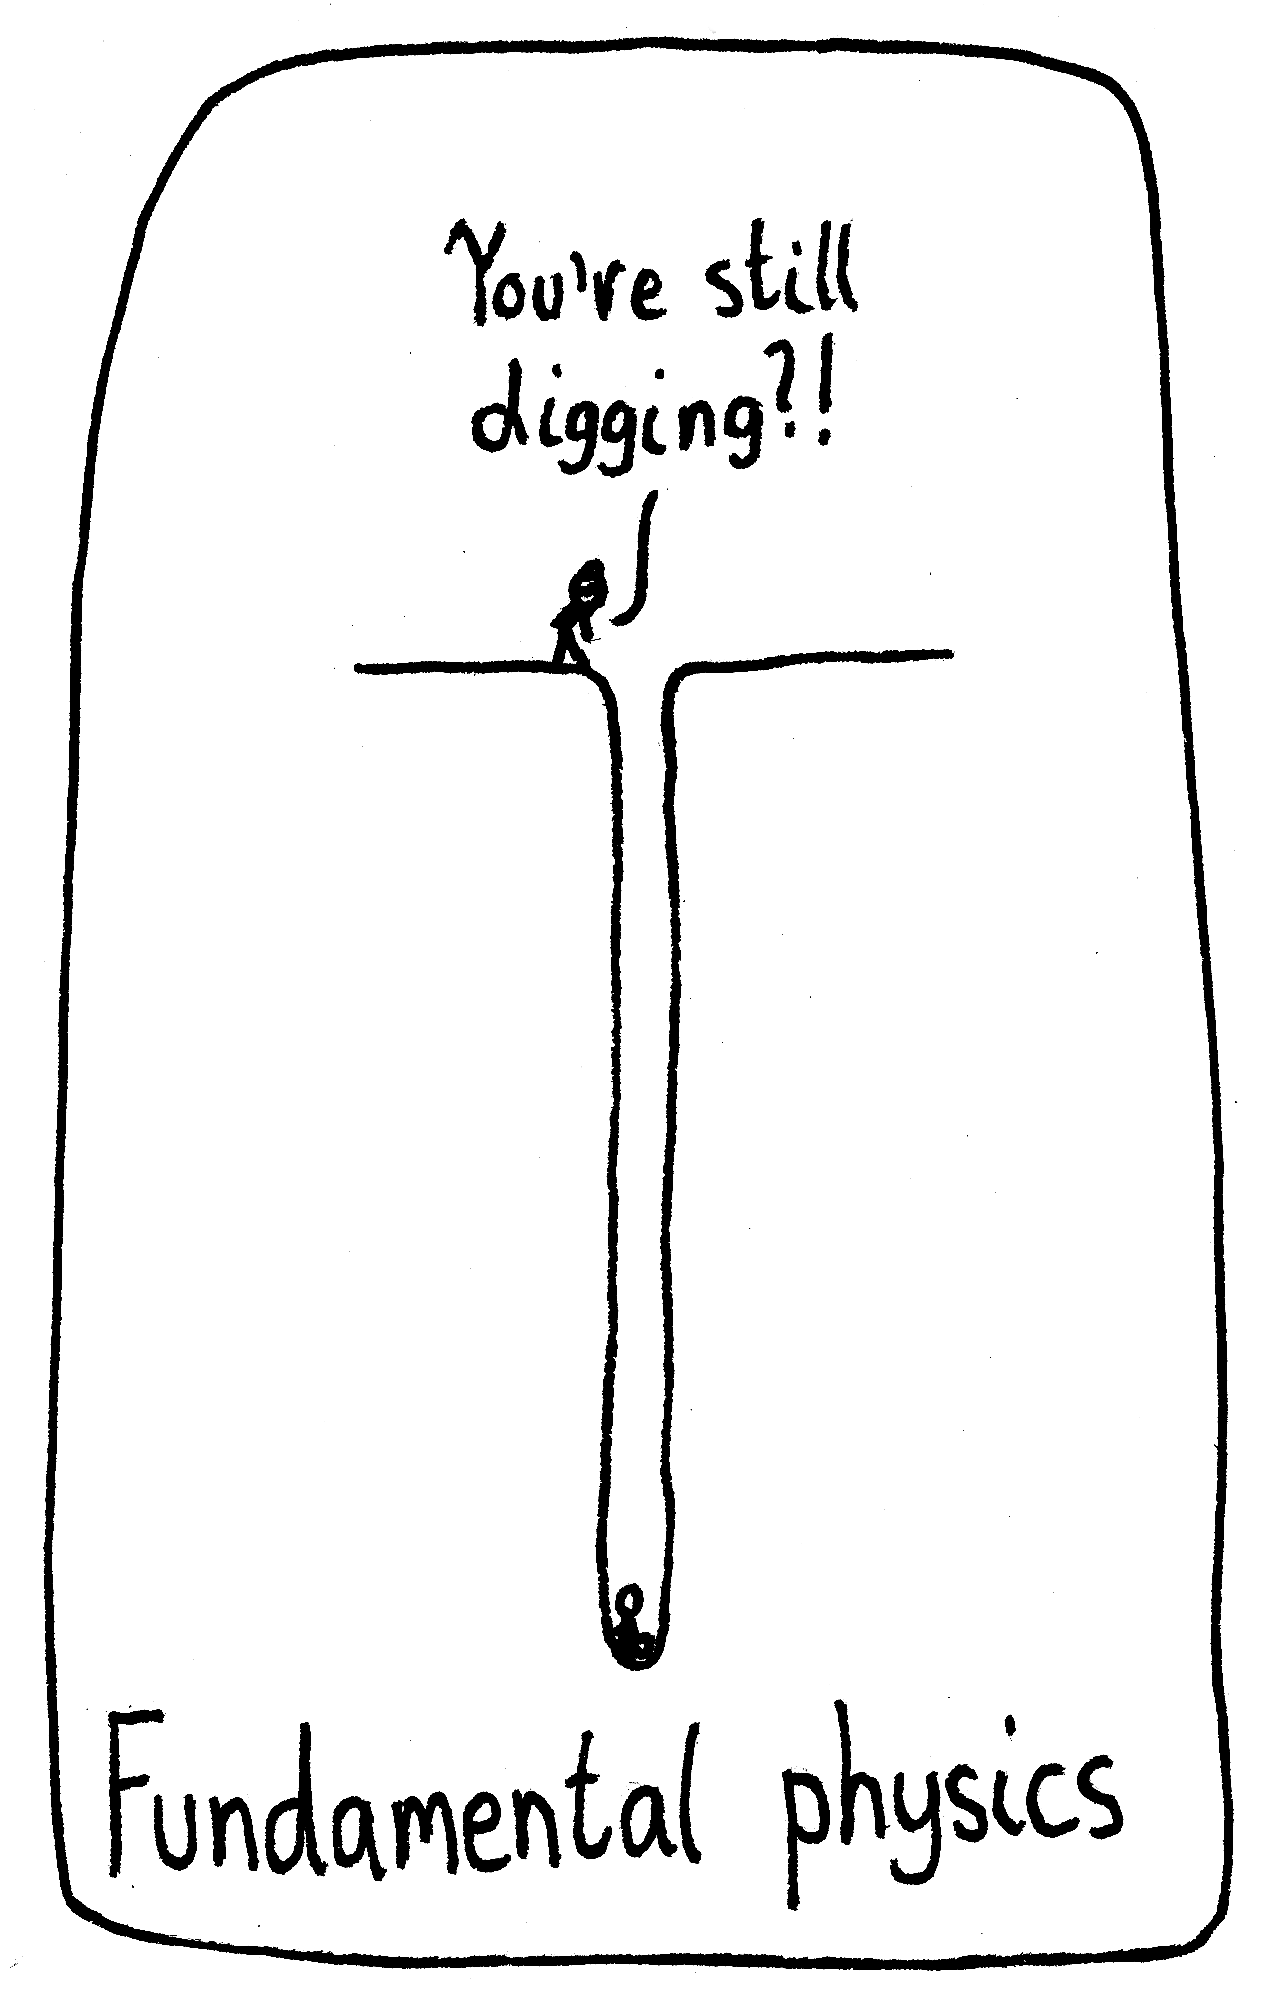
Fundamental physics: Asking “why” more often than a child since time immemorial.
26 Oct 2022Lookup
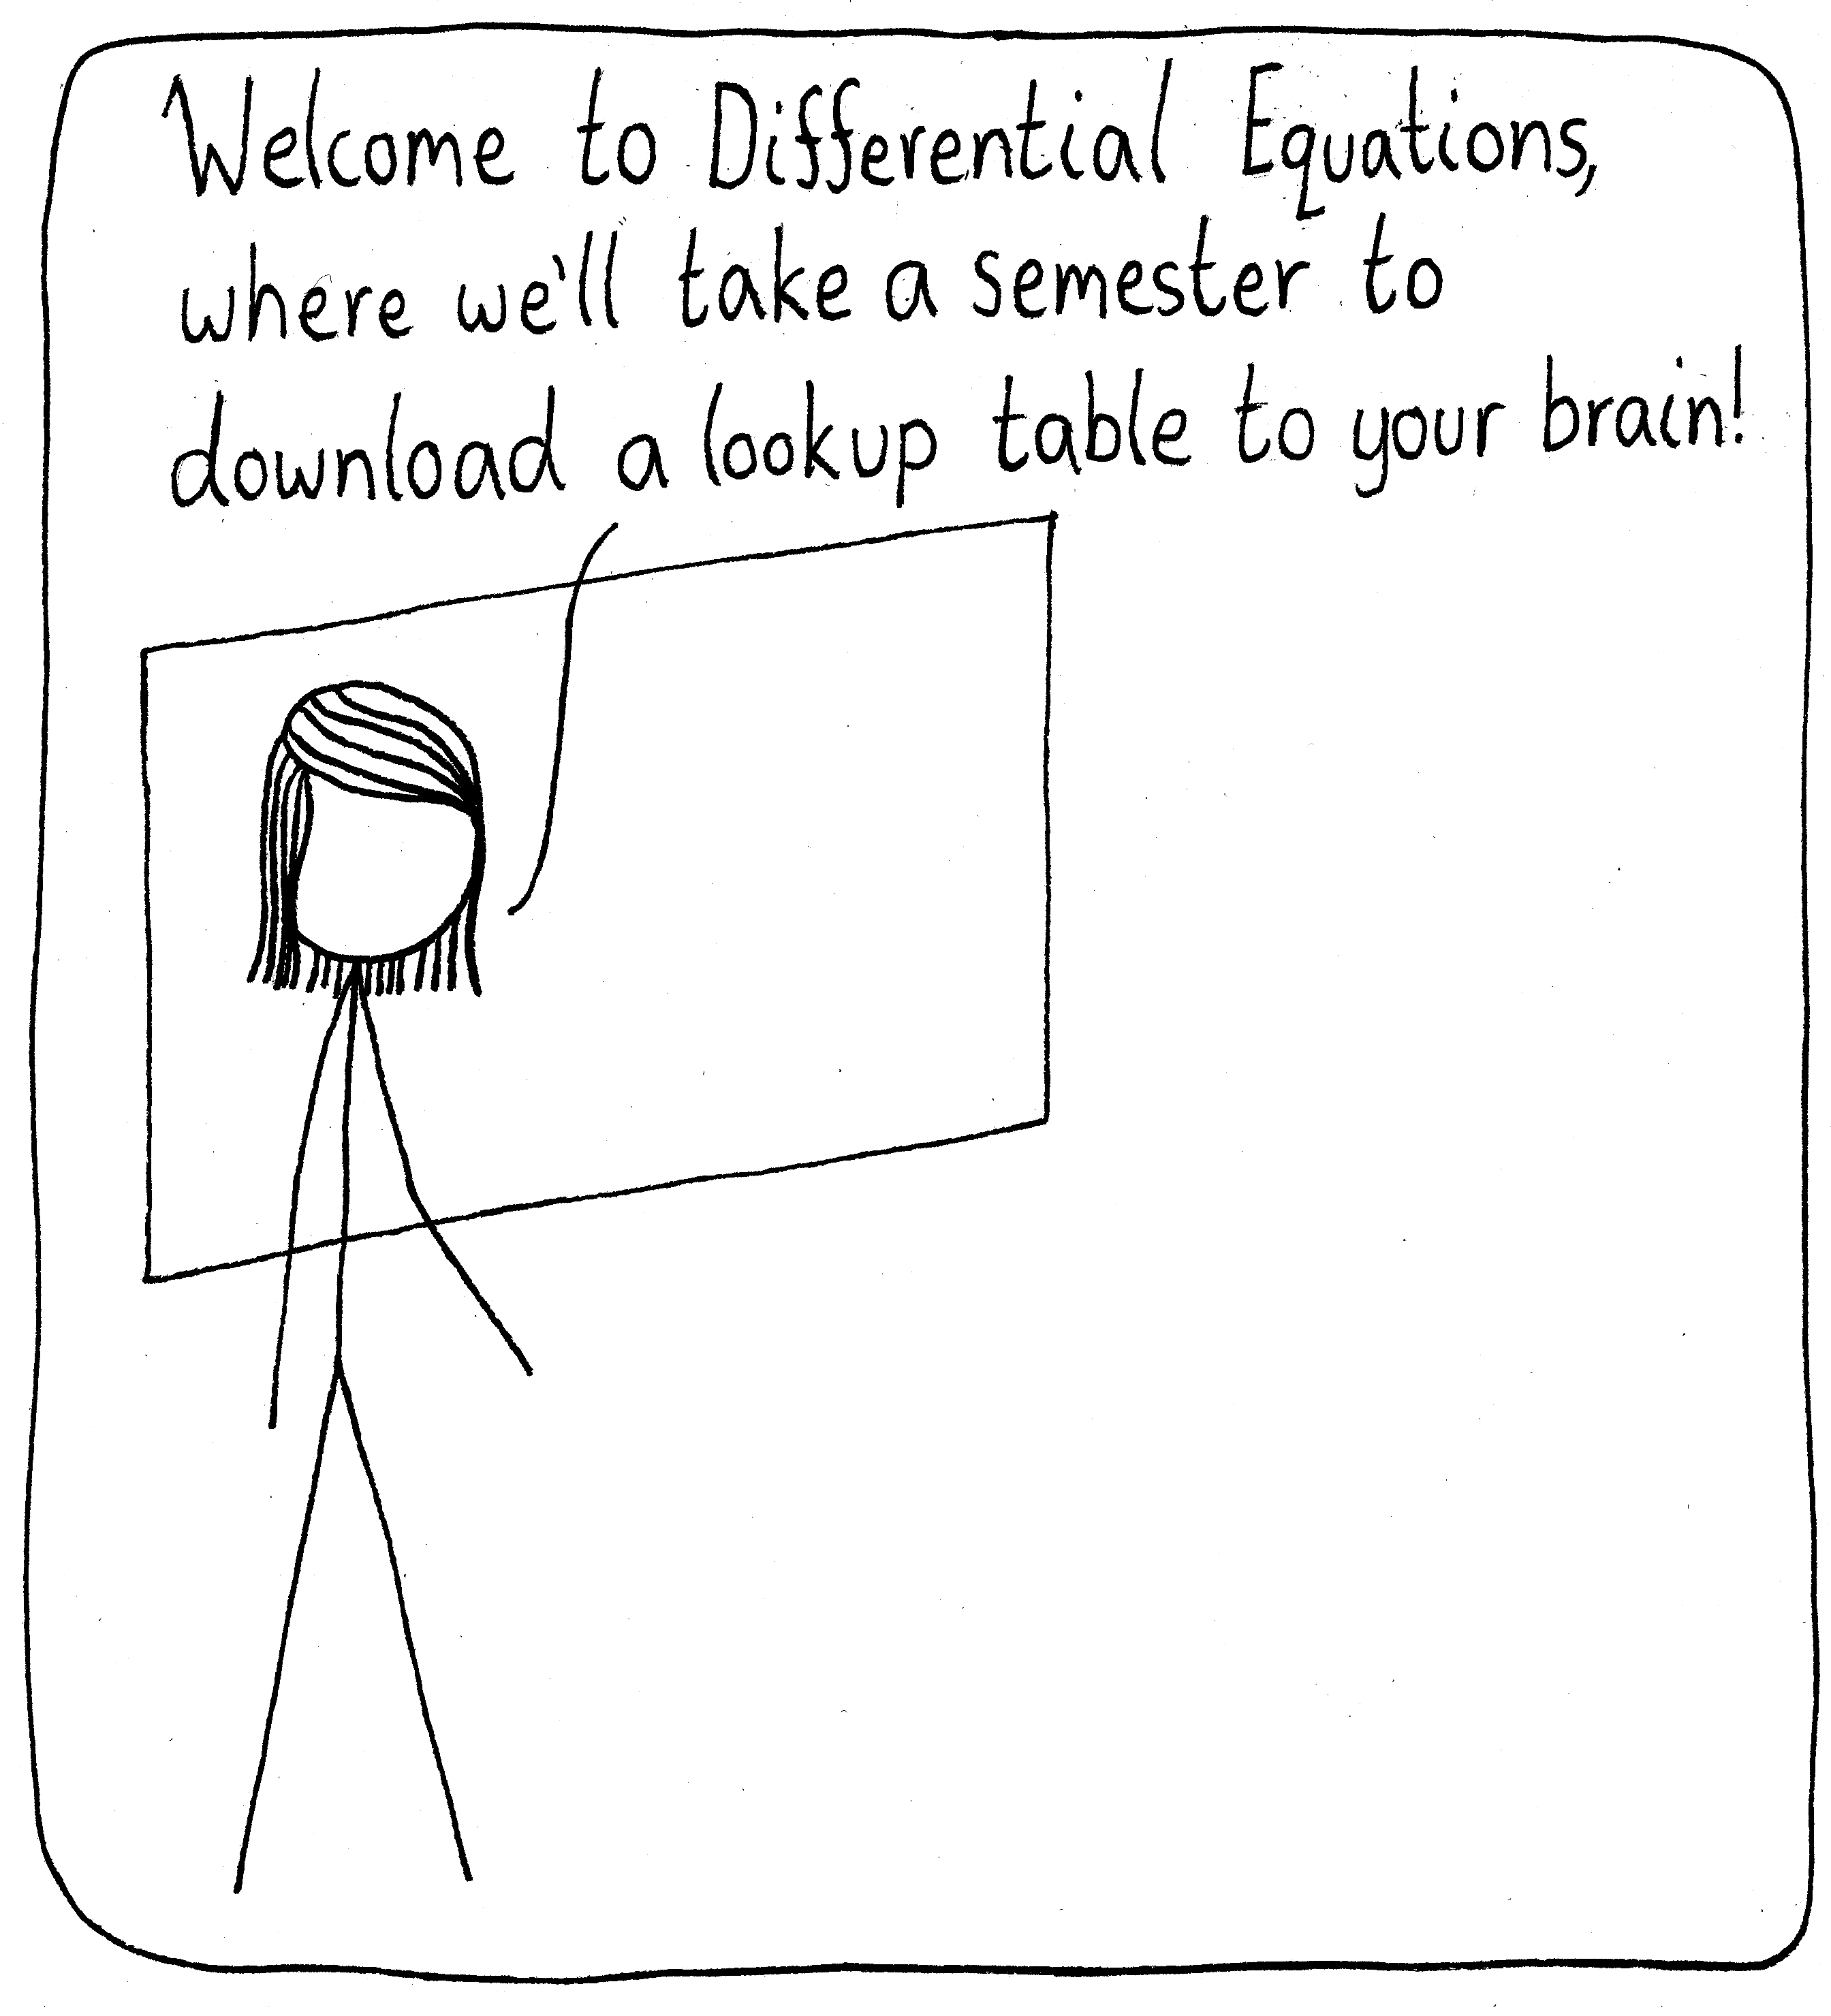
“Yes, I know the transfer is slow. We haven’t figured out a better way to do this yet.”
P.S. Hat tip to John Cook’s blog post that inspired this comic.
24 Oct 2022
Arbitrary

Classification is easy until you run up against the arbitrariness of a definition.
19 Oct 2022Scaling Gains

Actually, I just listened to a nice presentation by Jean-Gabriel Young who referred to a N2 algorithm as “bad”. So maybe my focus on theoretical computational complexity is just making me picky…
17 Oct 2022


Execution

If it doesn’t exist in the world, then it may as well not even be in your mind. Execution is key.
07 Oct 2022