Comics about mathematics, science, and the student life.

Play

This is why the solution to difficulties in work is sometimes: Take a break and do something else.
30 Sep 2022

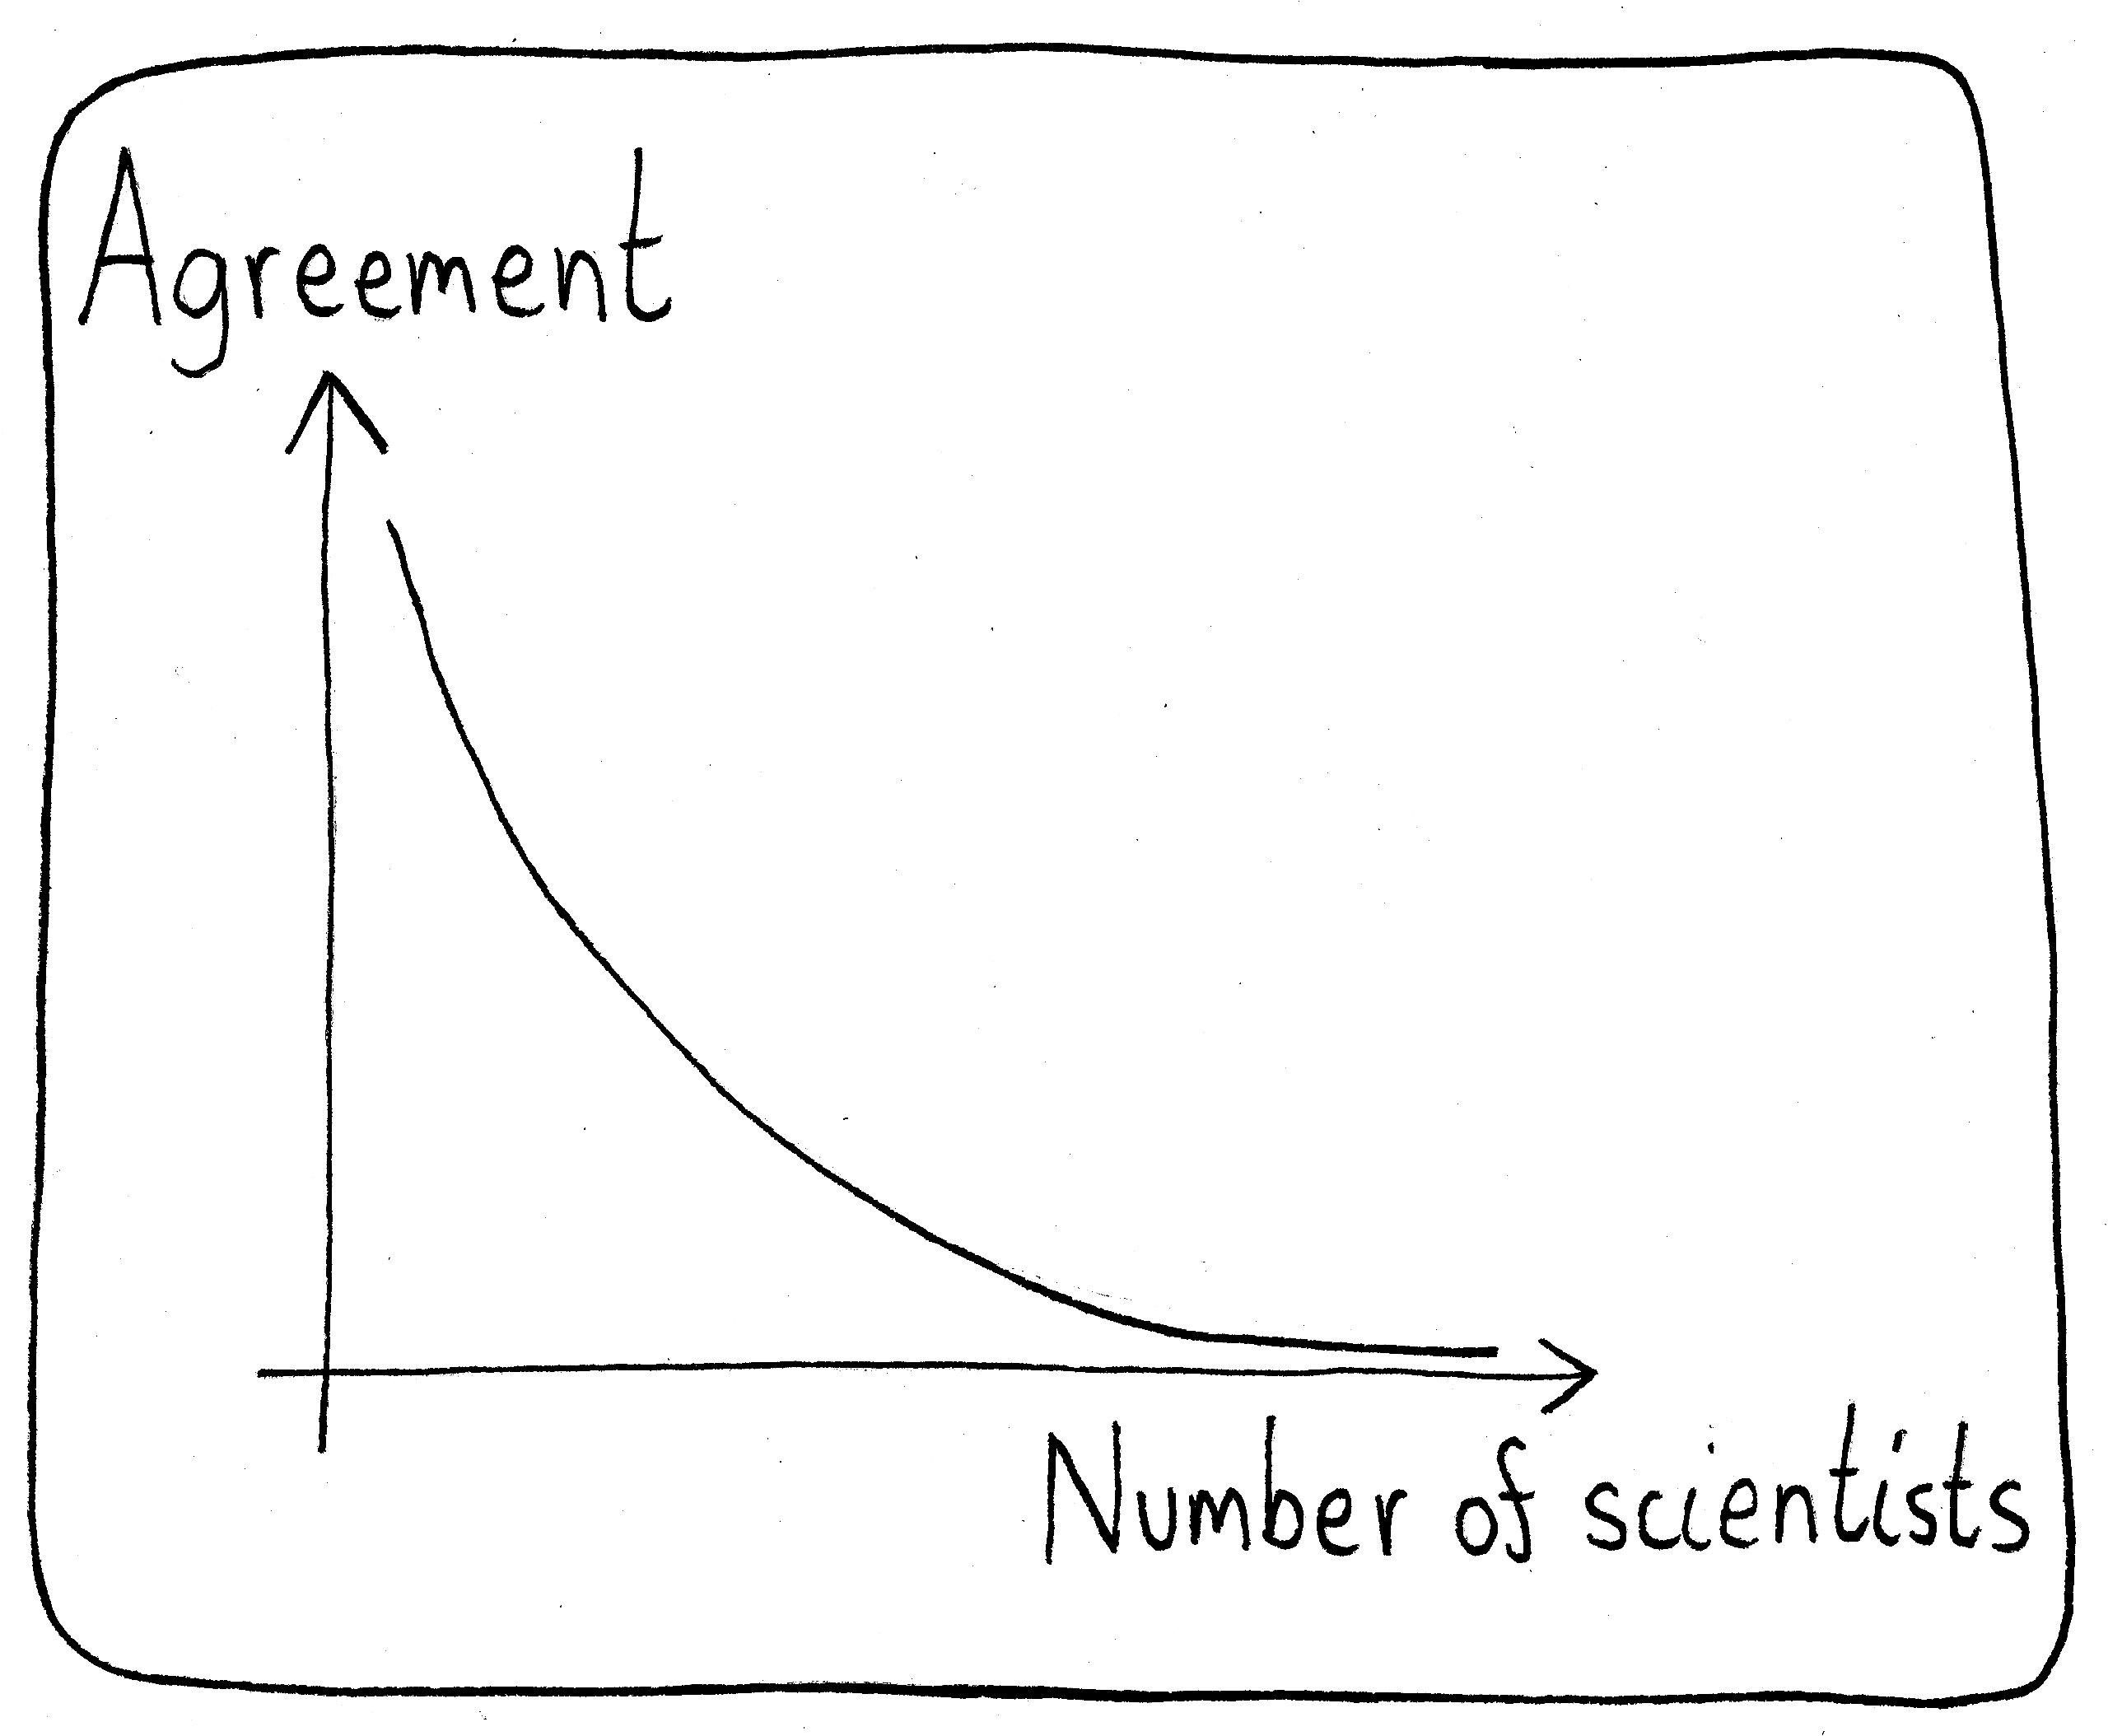
Skeuomorphism

Scientists: Never moving to a new technology because they are attached to backwards compatibility.
23 Sep 2022Hurdles

Just because you wanted it once doesn’t mean you need to go after it until the day you die.
21 Sep 2022Familiar

“I know everything we’re about to say in this conversation, but sure, let’s do it over again.”
19 Sep 2022The Right Game
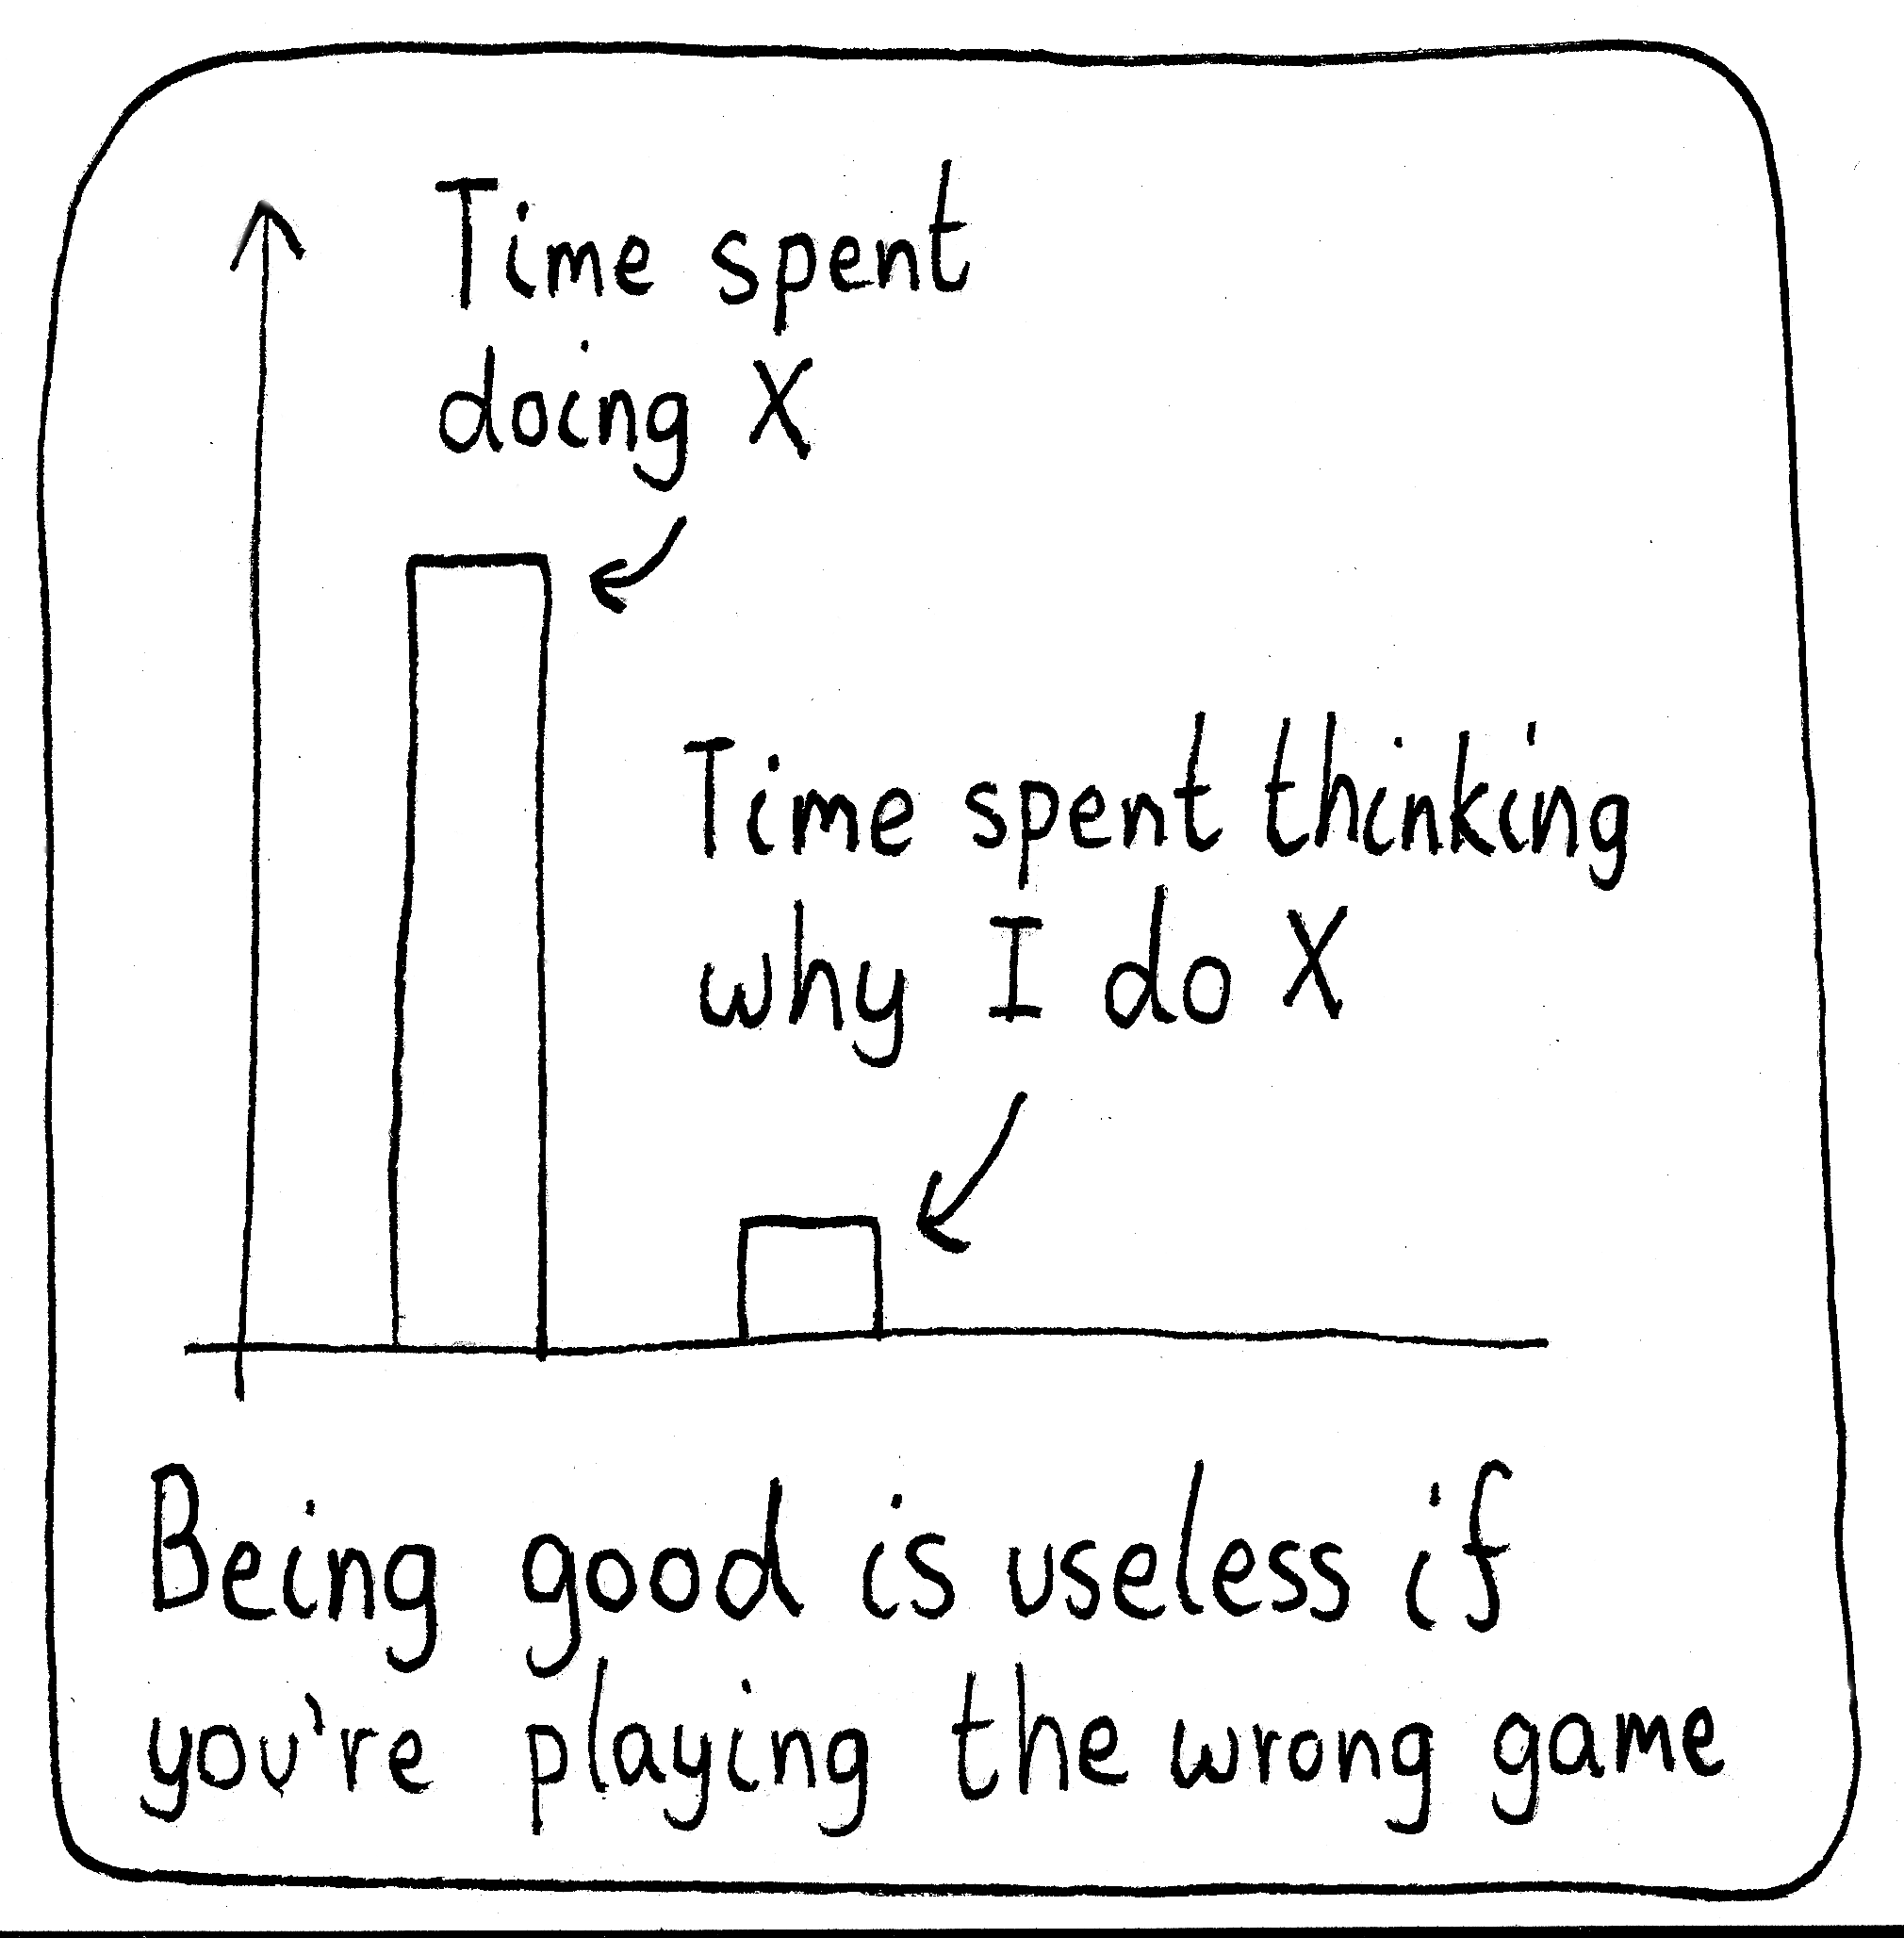
The problem, of course, is that being good at X often makes me feel that I should be doing X, even if it’s not ultimately what I want.
16 Sep 2022