Comics about mathematics, science, and the student life.
Partitioning Skills
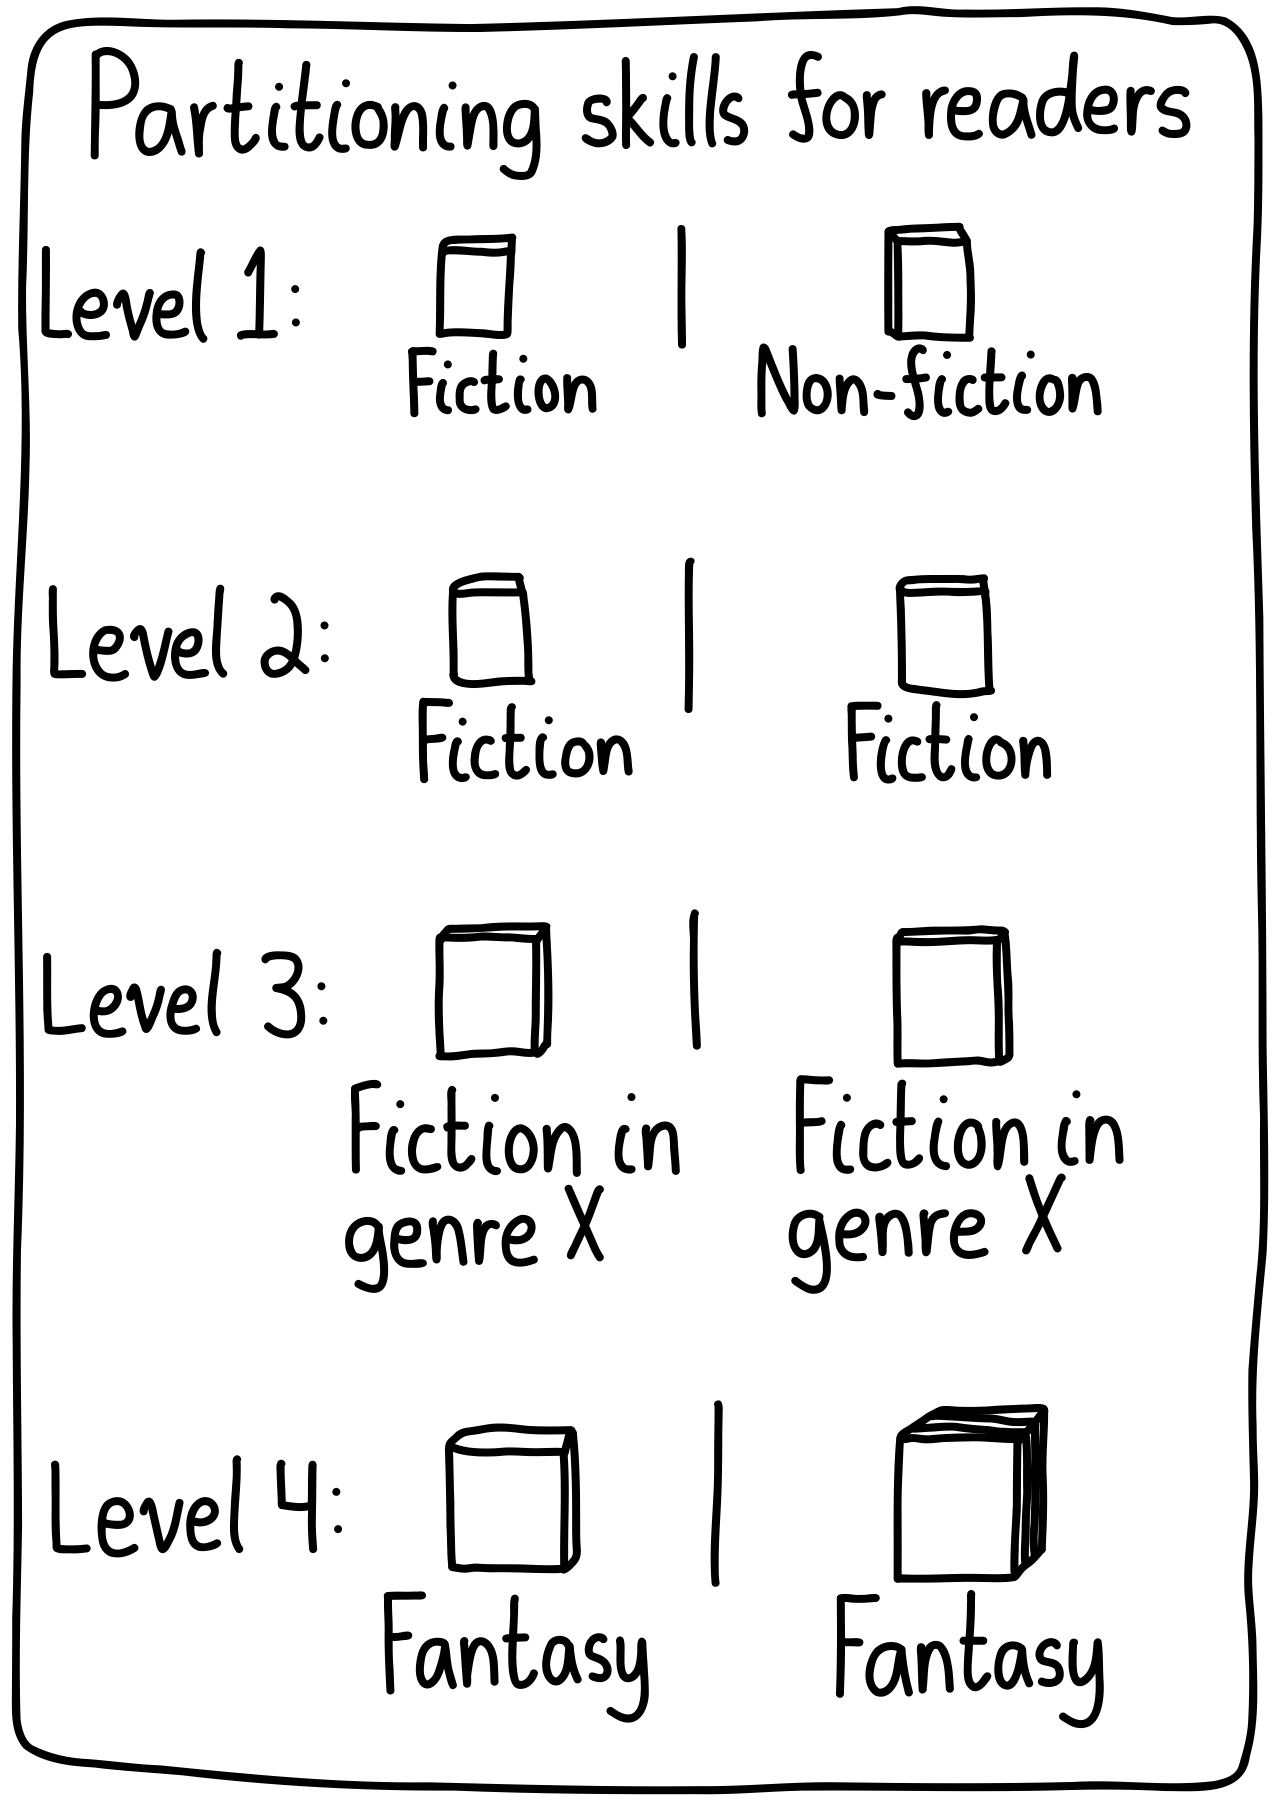
You know things are bad when you’re deep in the obsession phase for a story but you start mixing in characters and plot elements from the other book you’re reading.
26 Apr 2025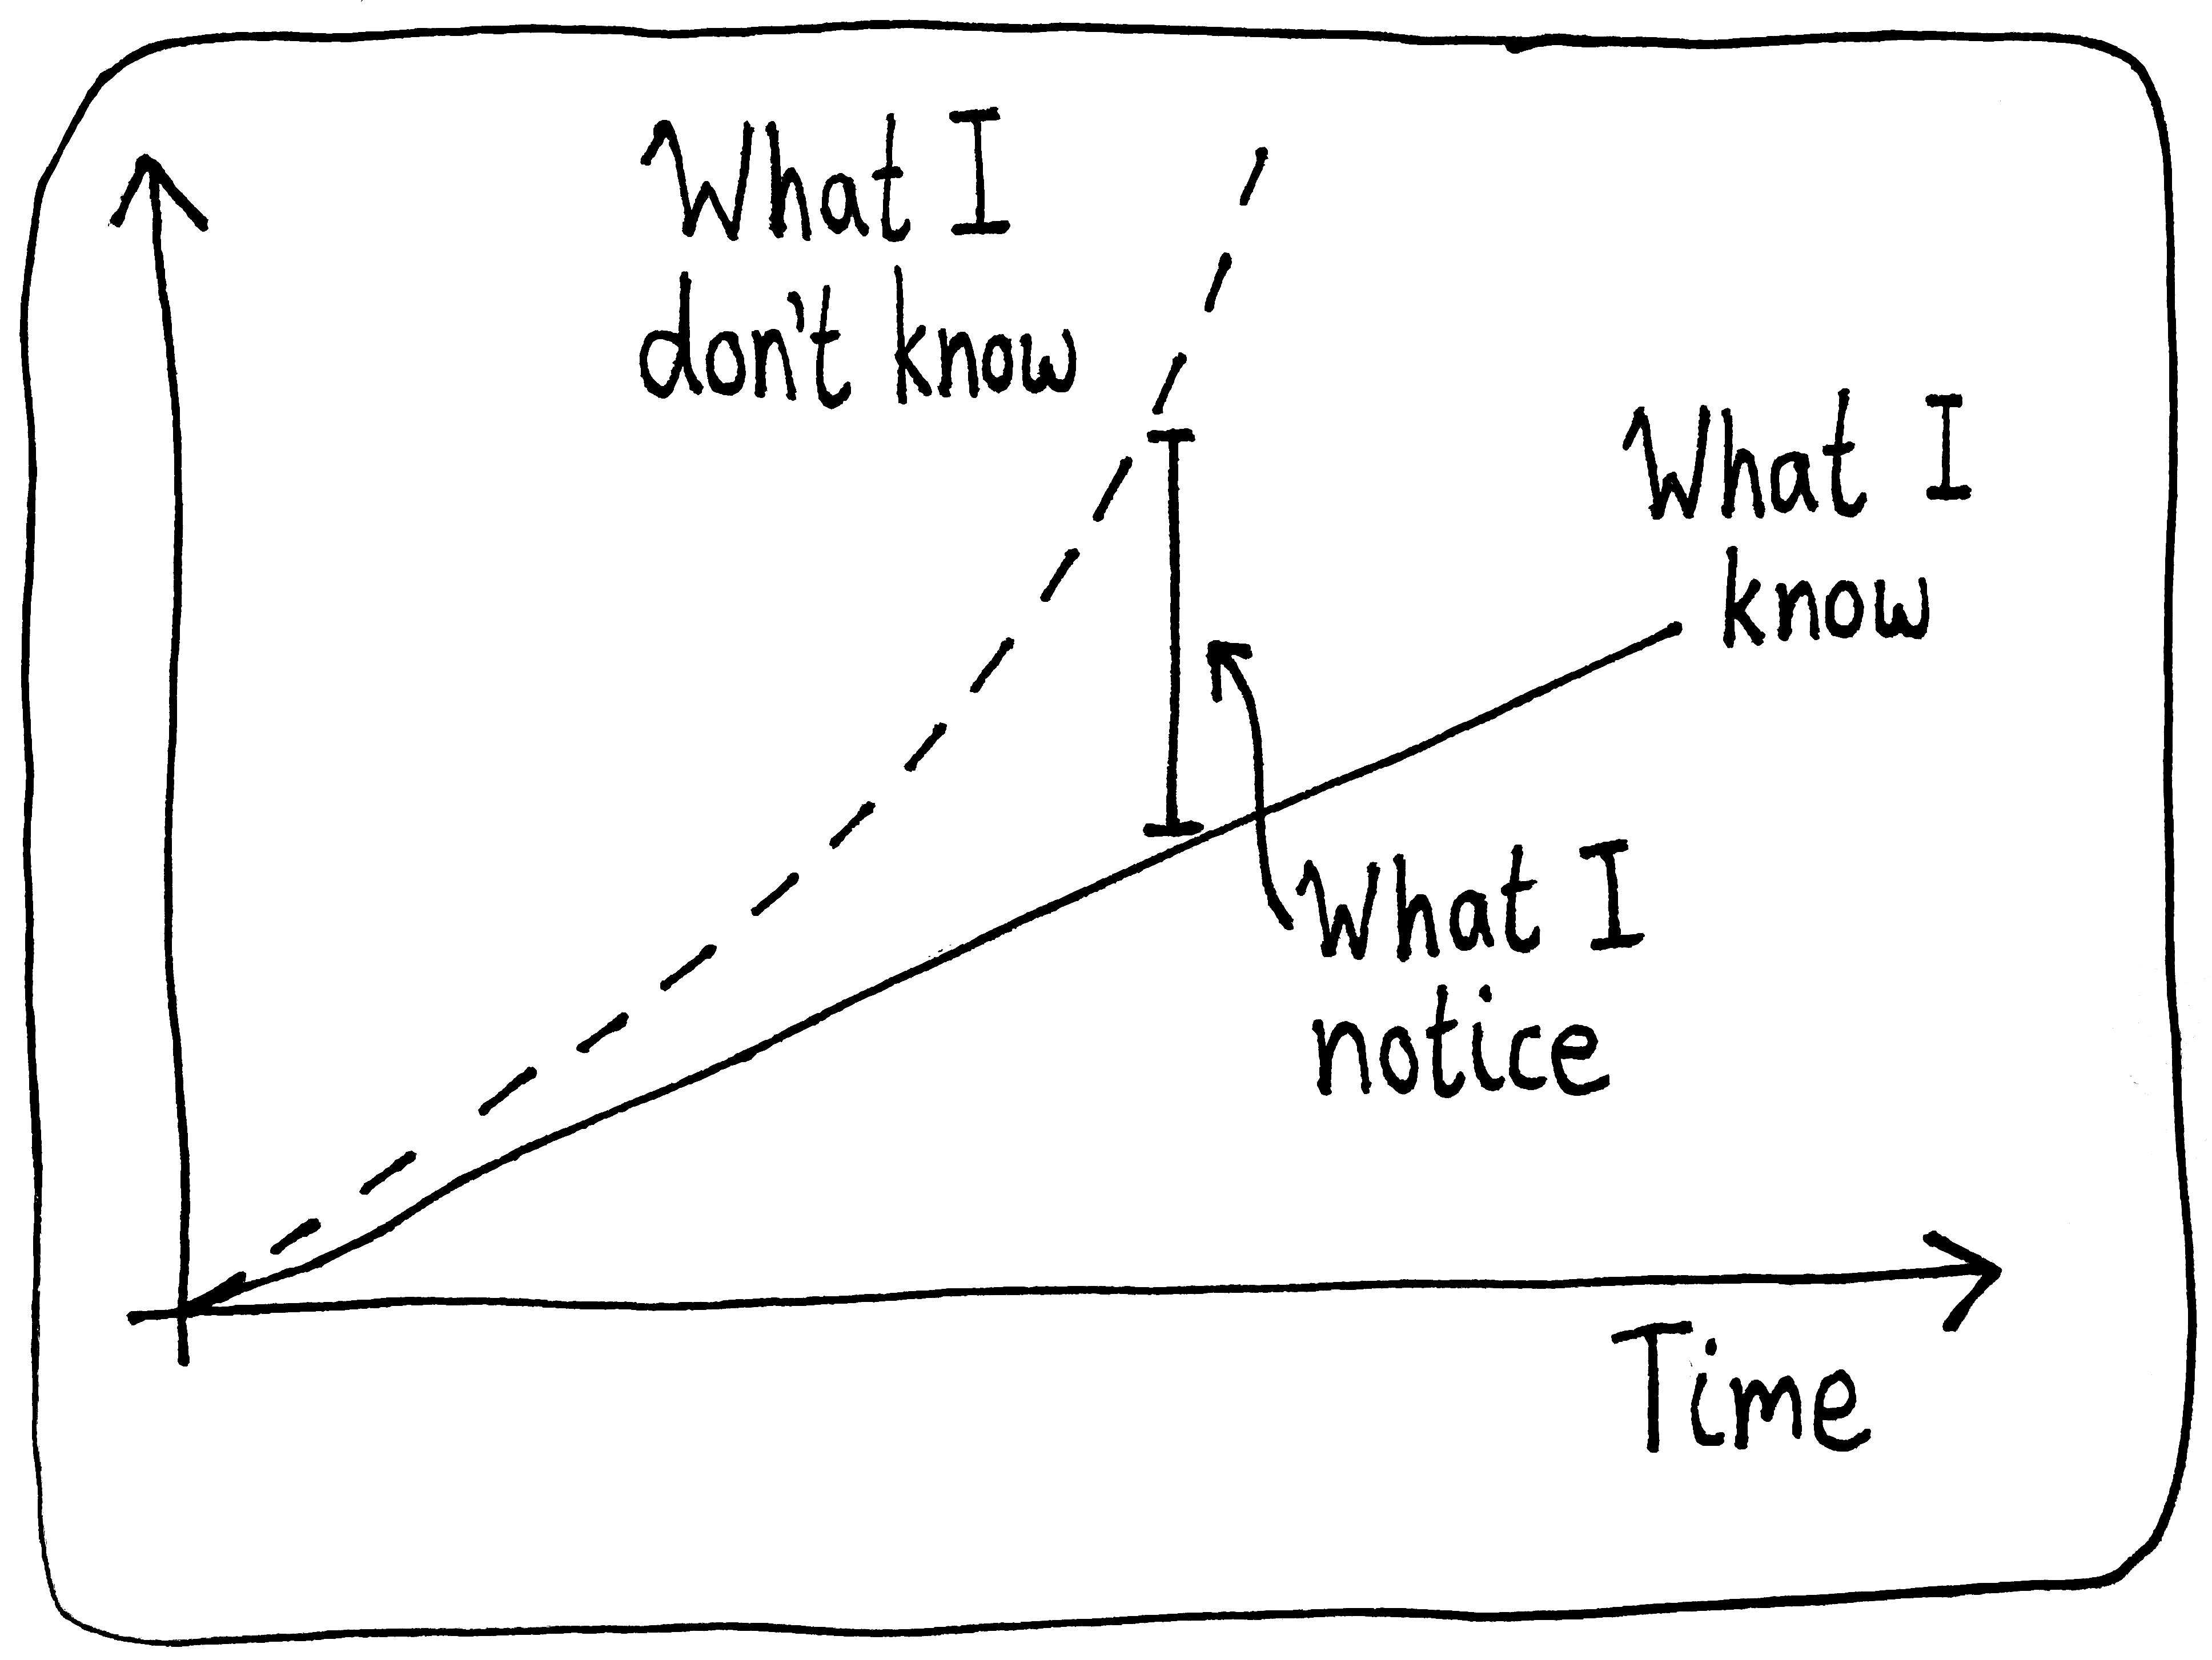
Compactify
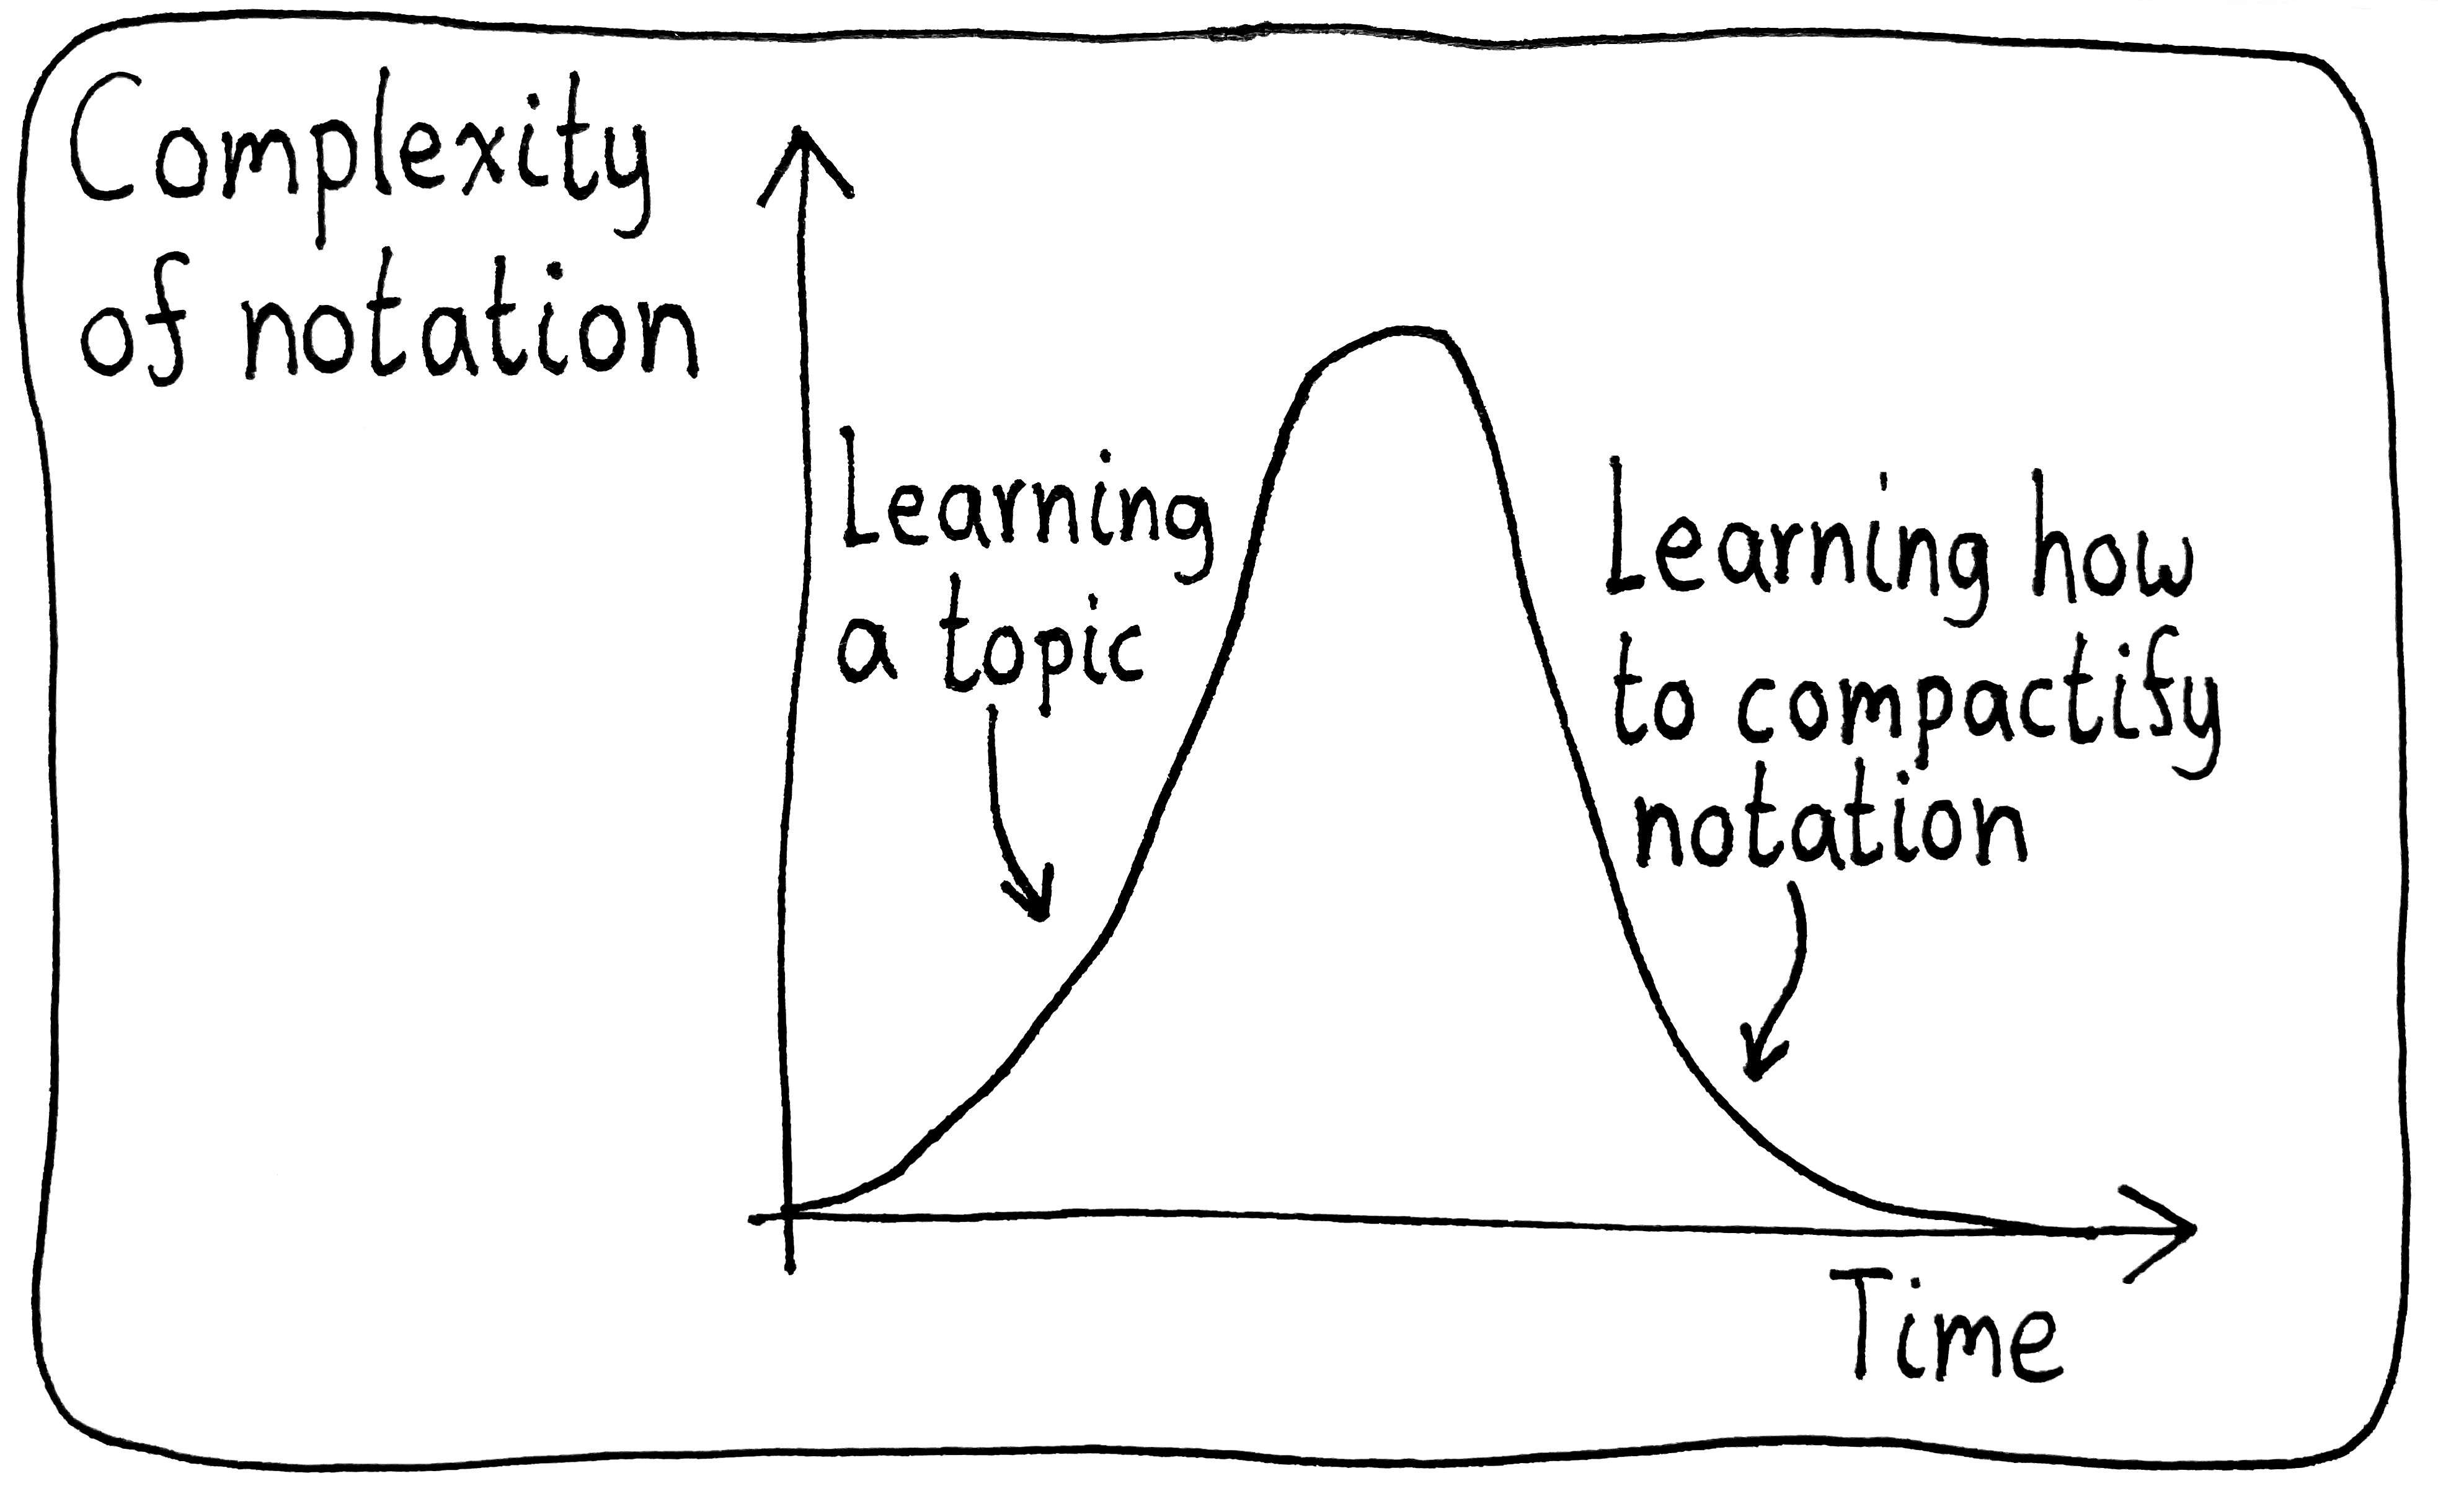
Unfortunately, we often present mathematics in the opposite order, where we show the nice and tidy formula which only makes sense to someone with a lot of experience and intuition on the subject.
12 Apr 2025Bankruptcy

Who am I kidding: I sometimes get nervous about deleting anything, and so I just let the list languish. Sometimes, I switch to new services to achieve the same effect!
06 Apr 2025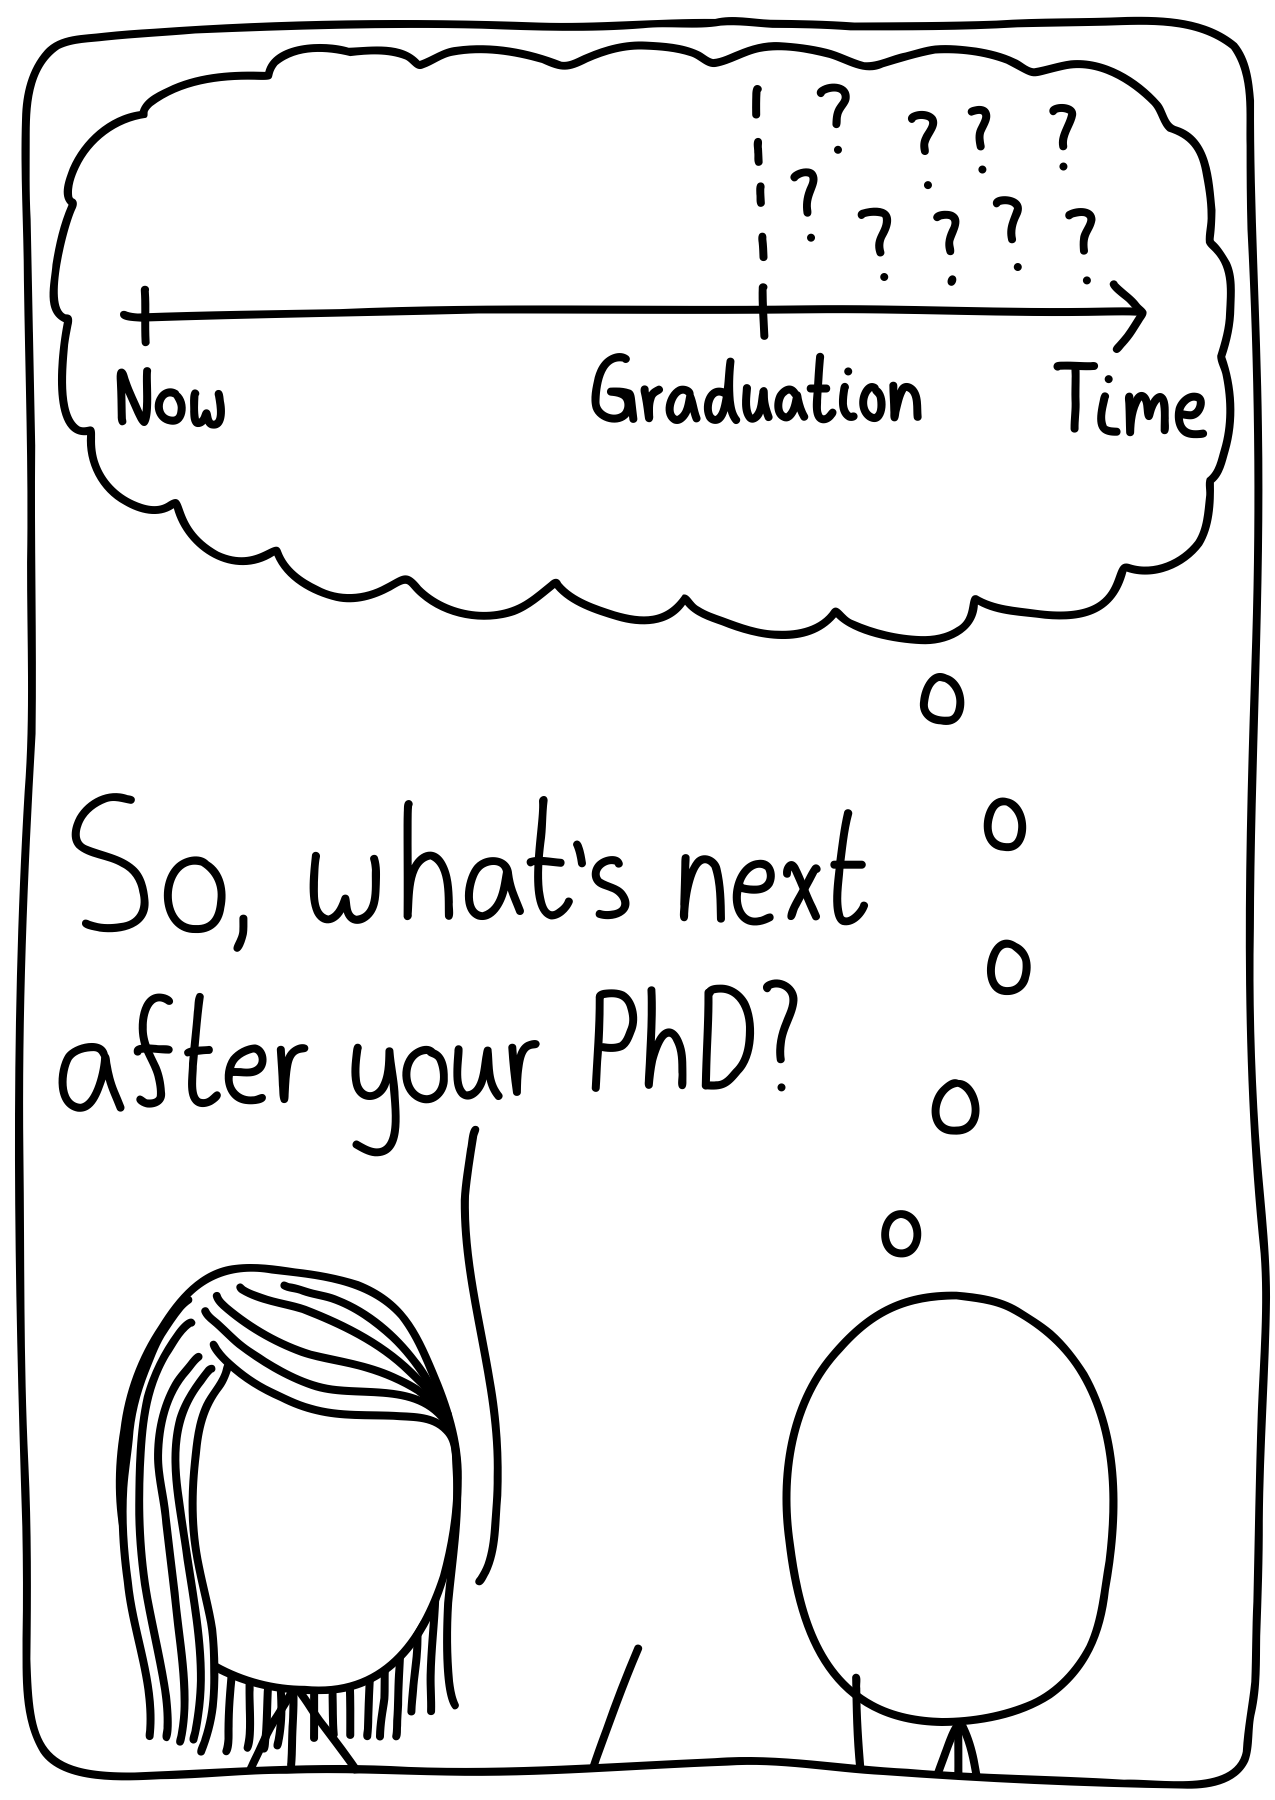
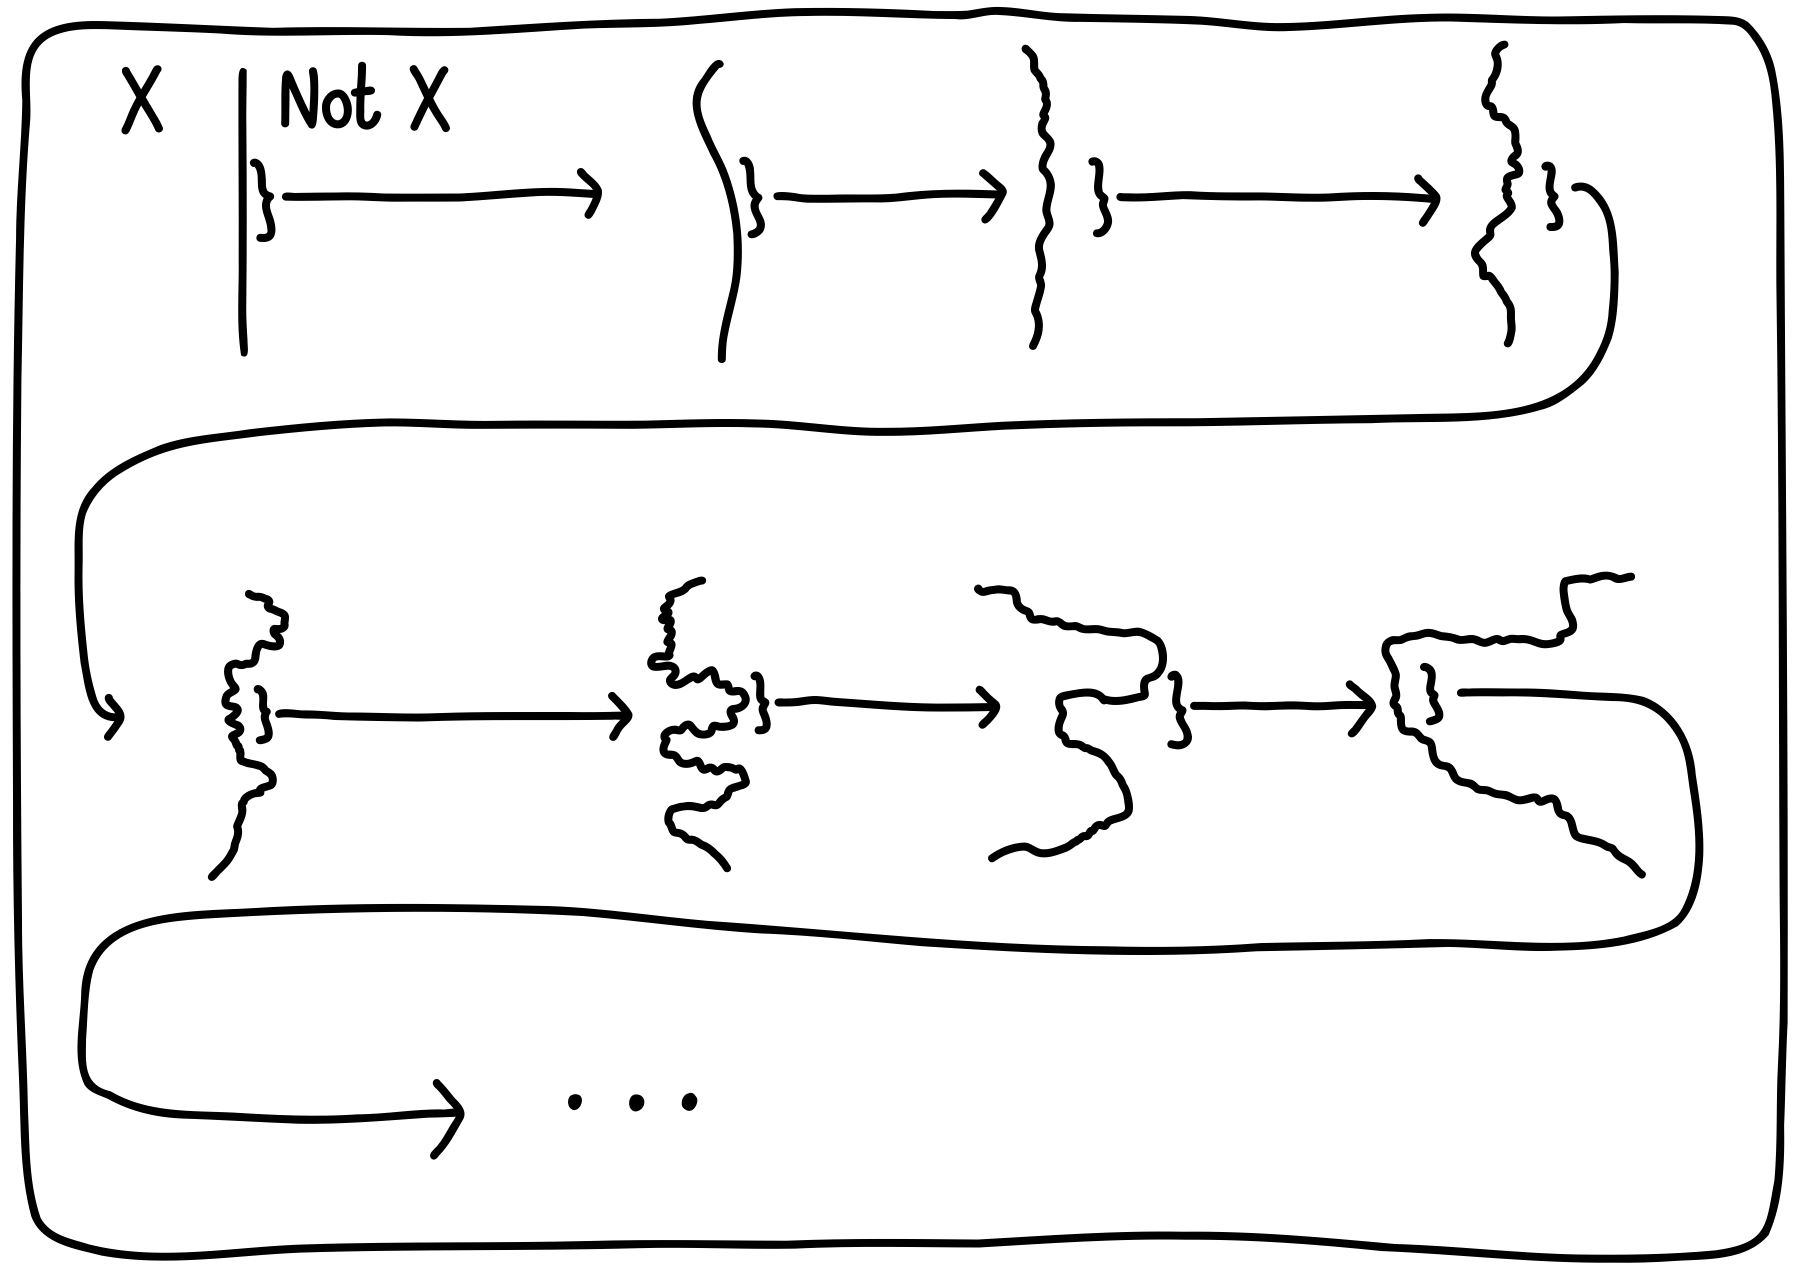
Retention
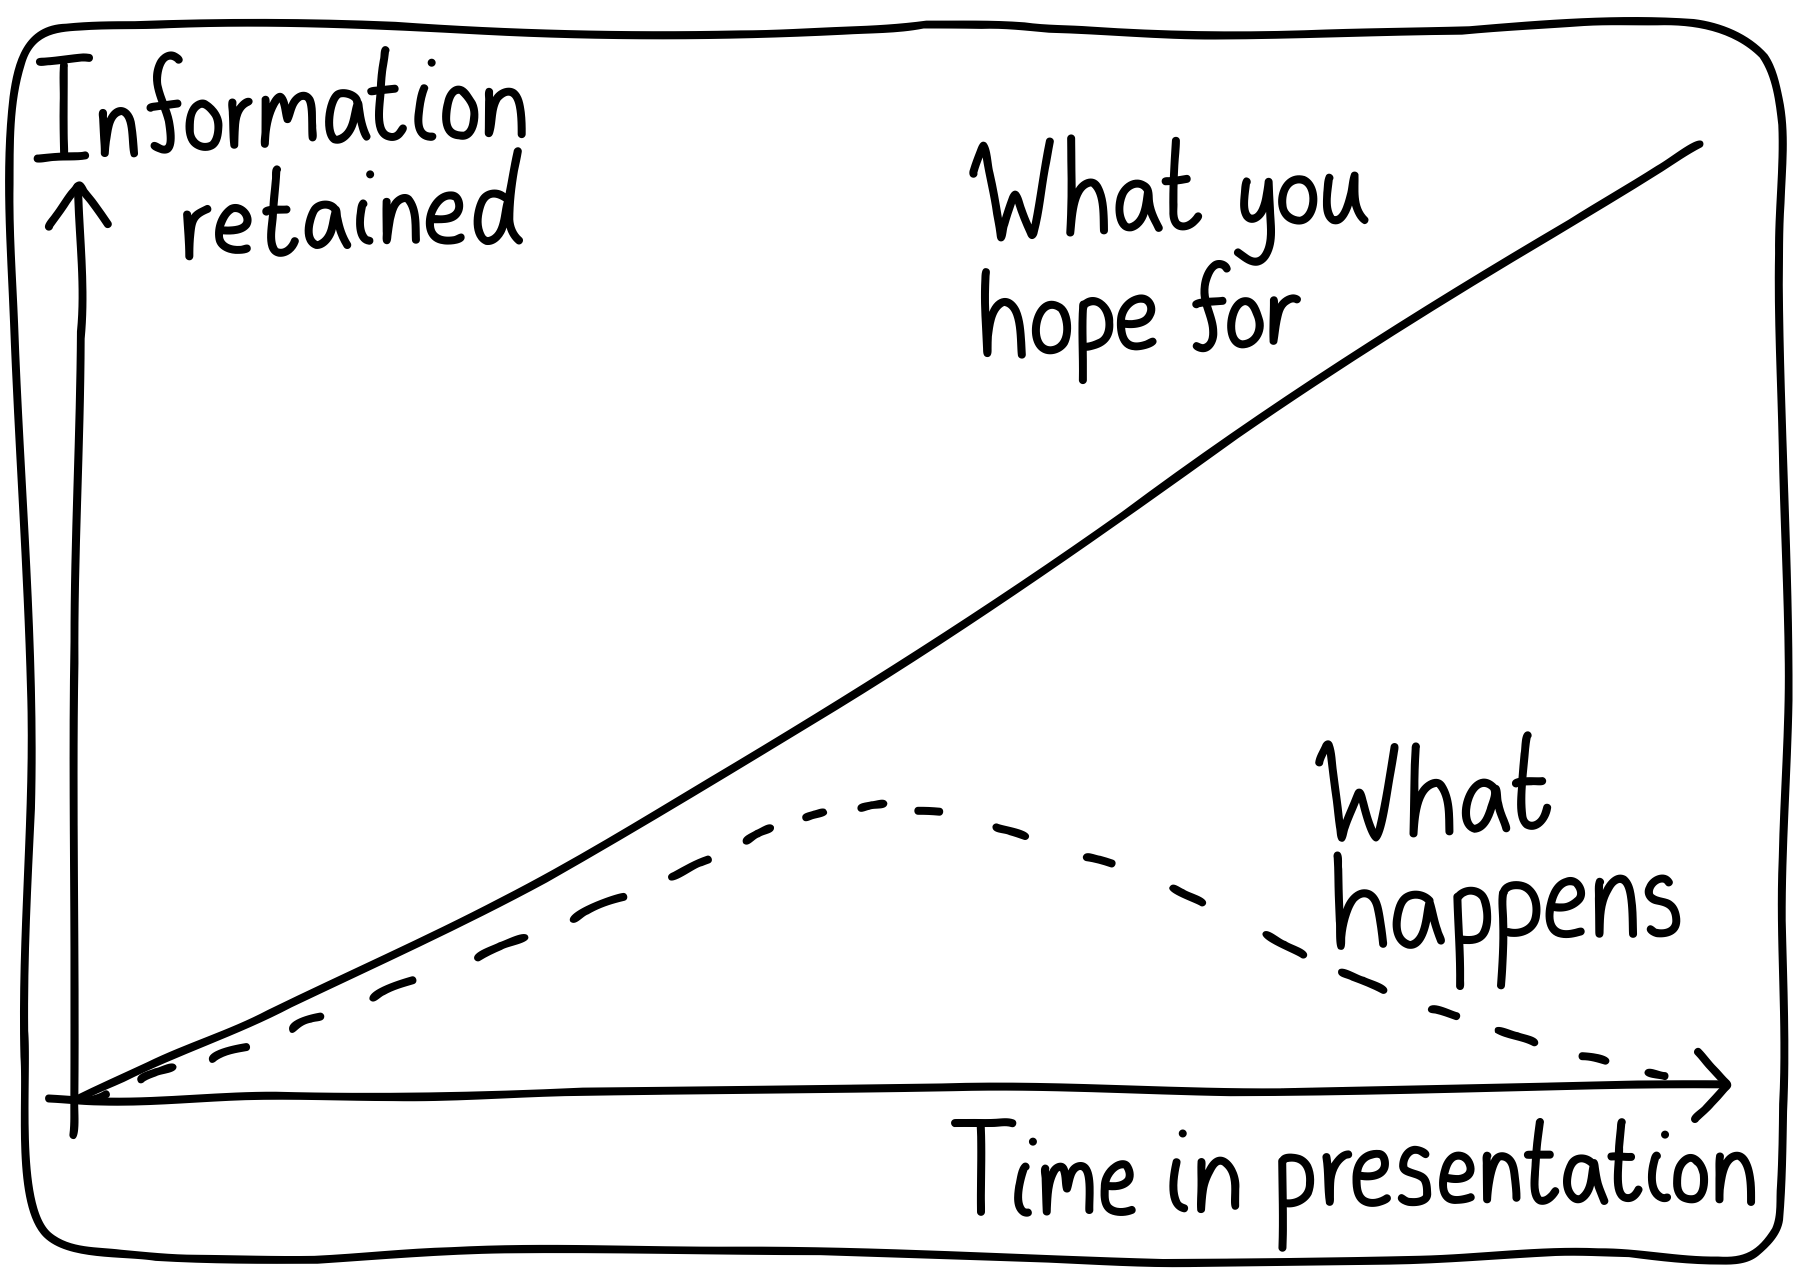
Two reasons: working memory overload and fatigue. It’s a fantasy to imagine that my audience will immediately soak up everything I share.
22 Mar 2025Outline
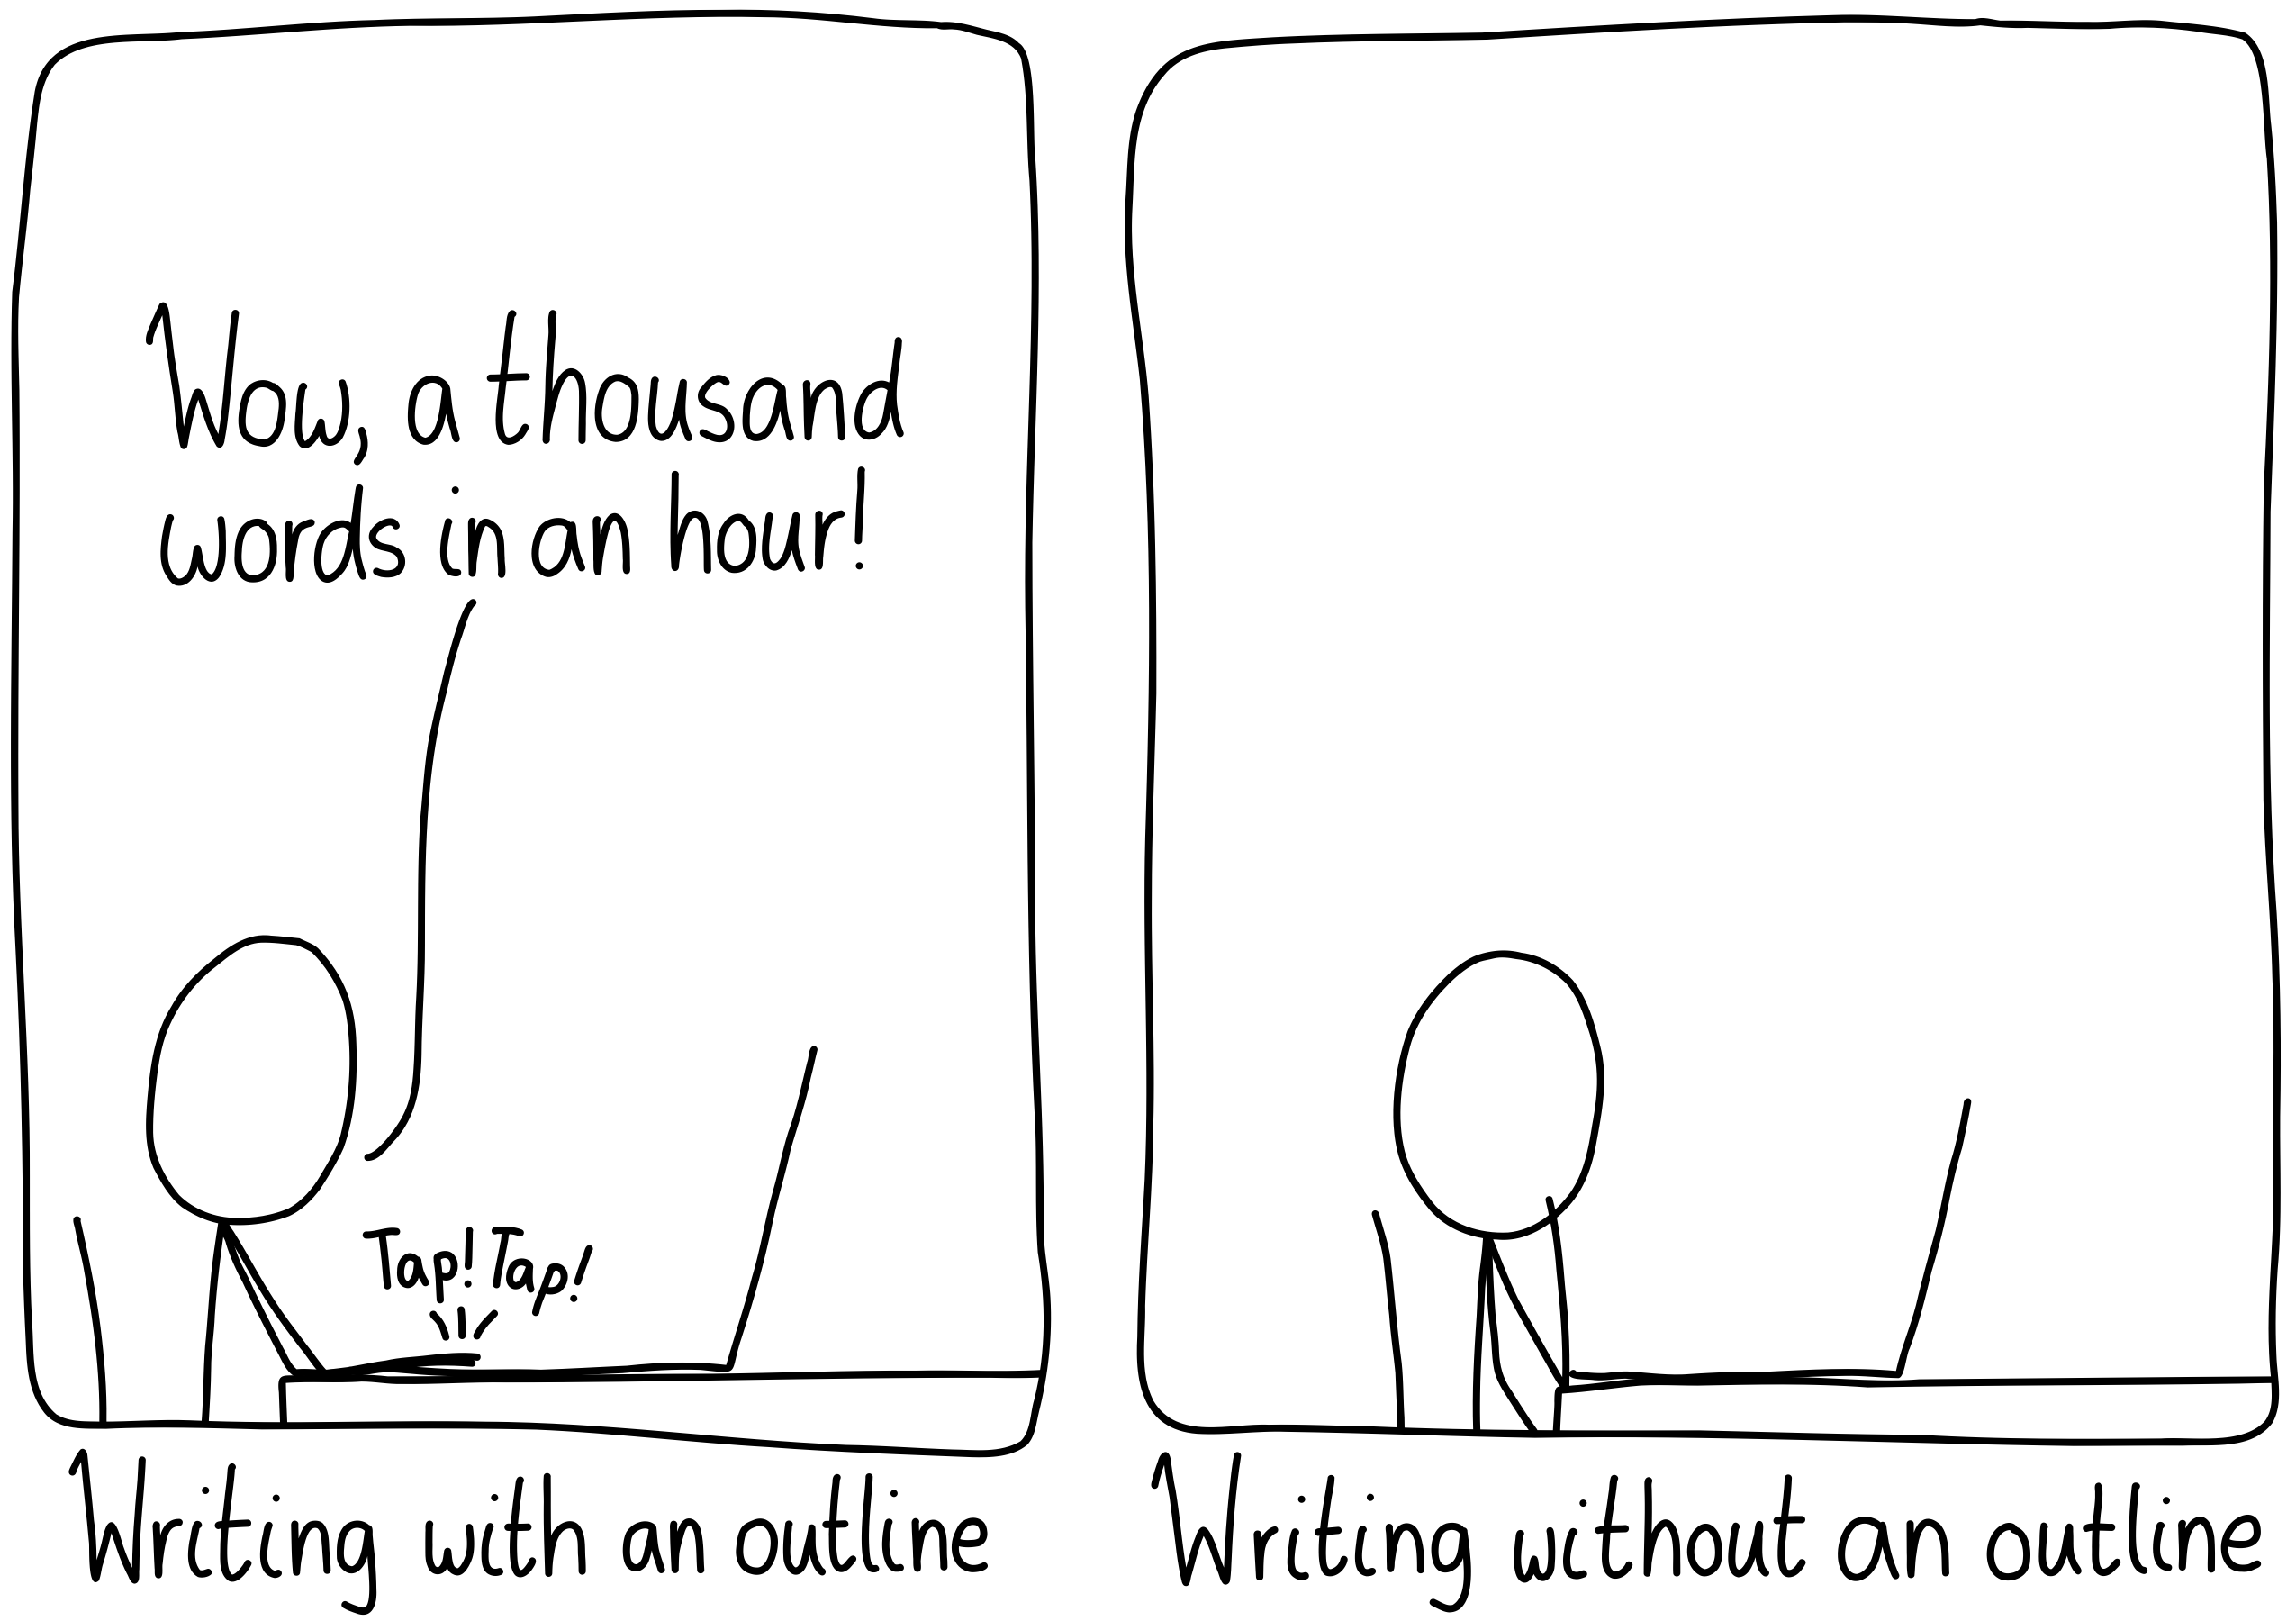
As I’m in the midst of thesis-writing, I definitely understand the power of the left panel!
15 Mar 2025The Distraction Hump
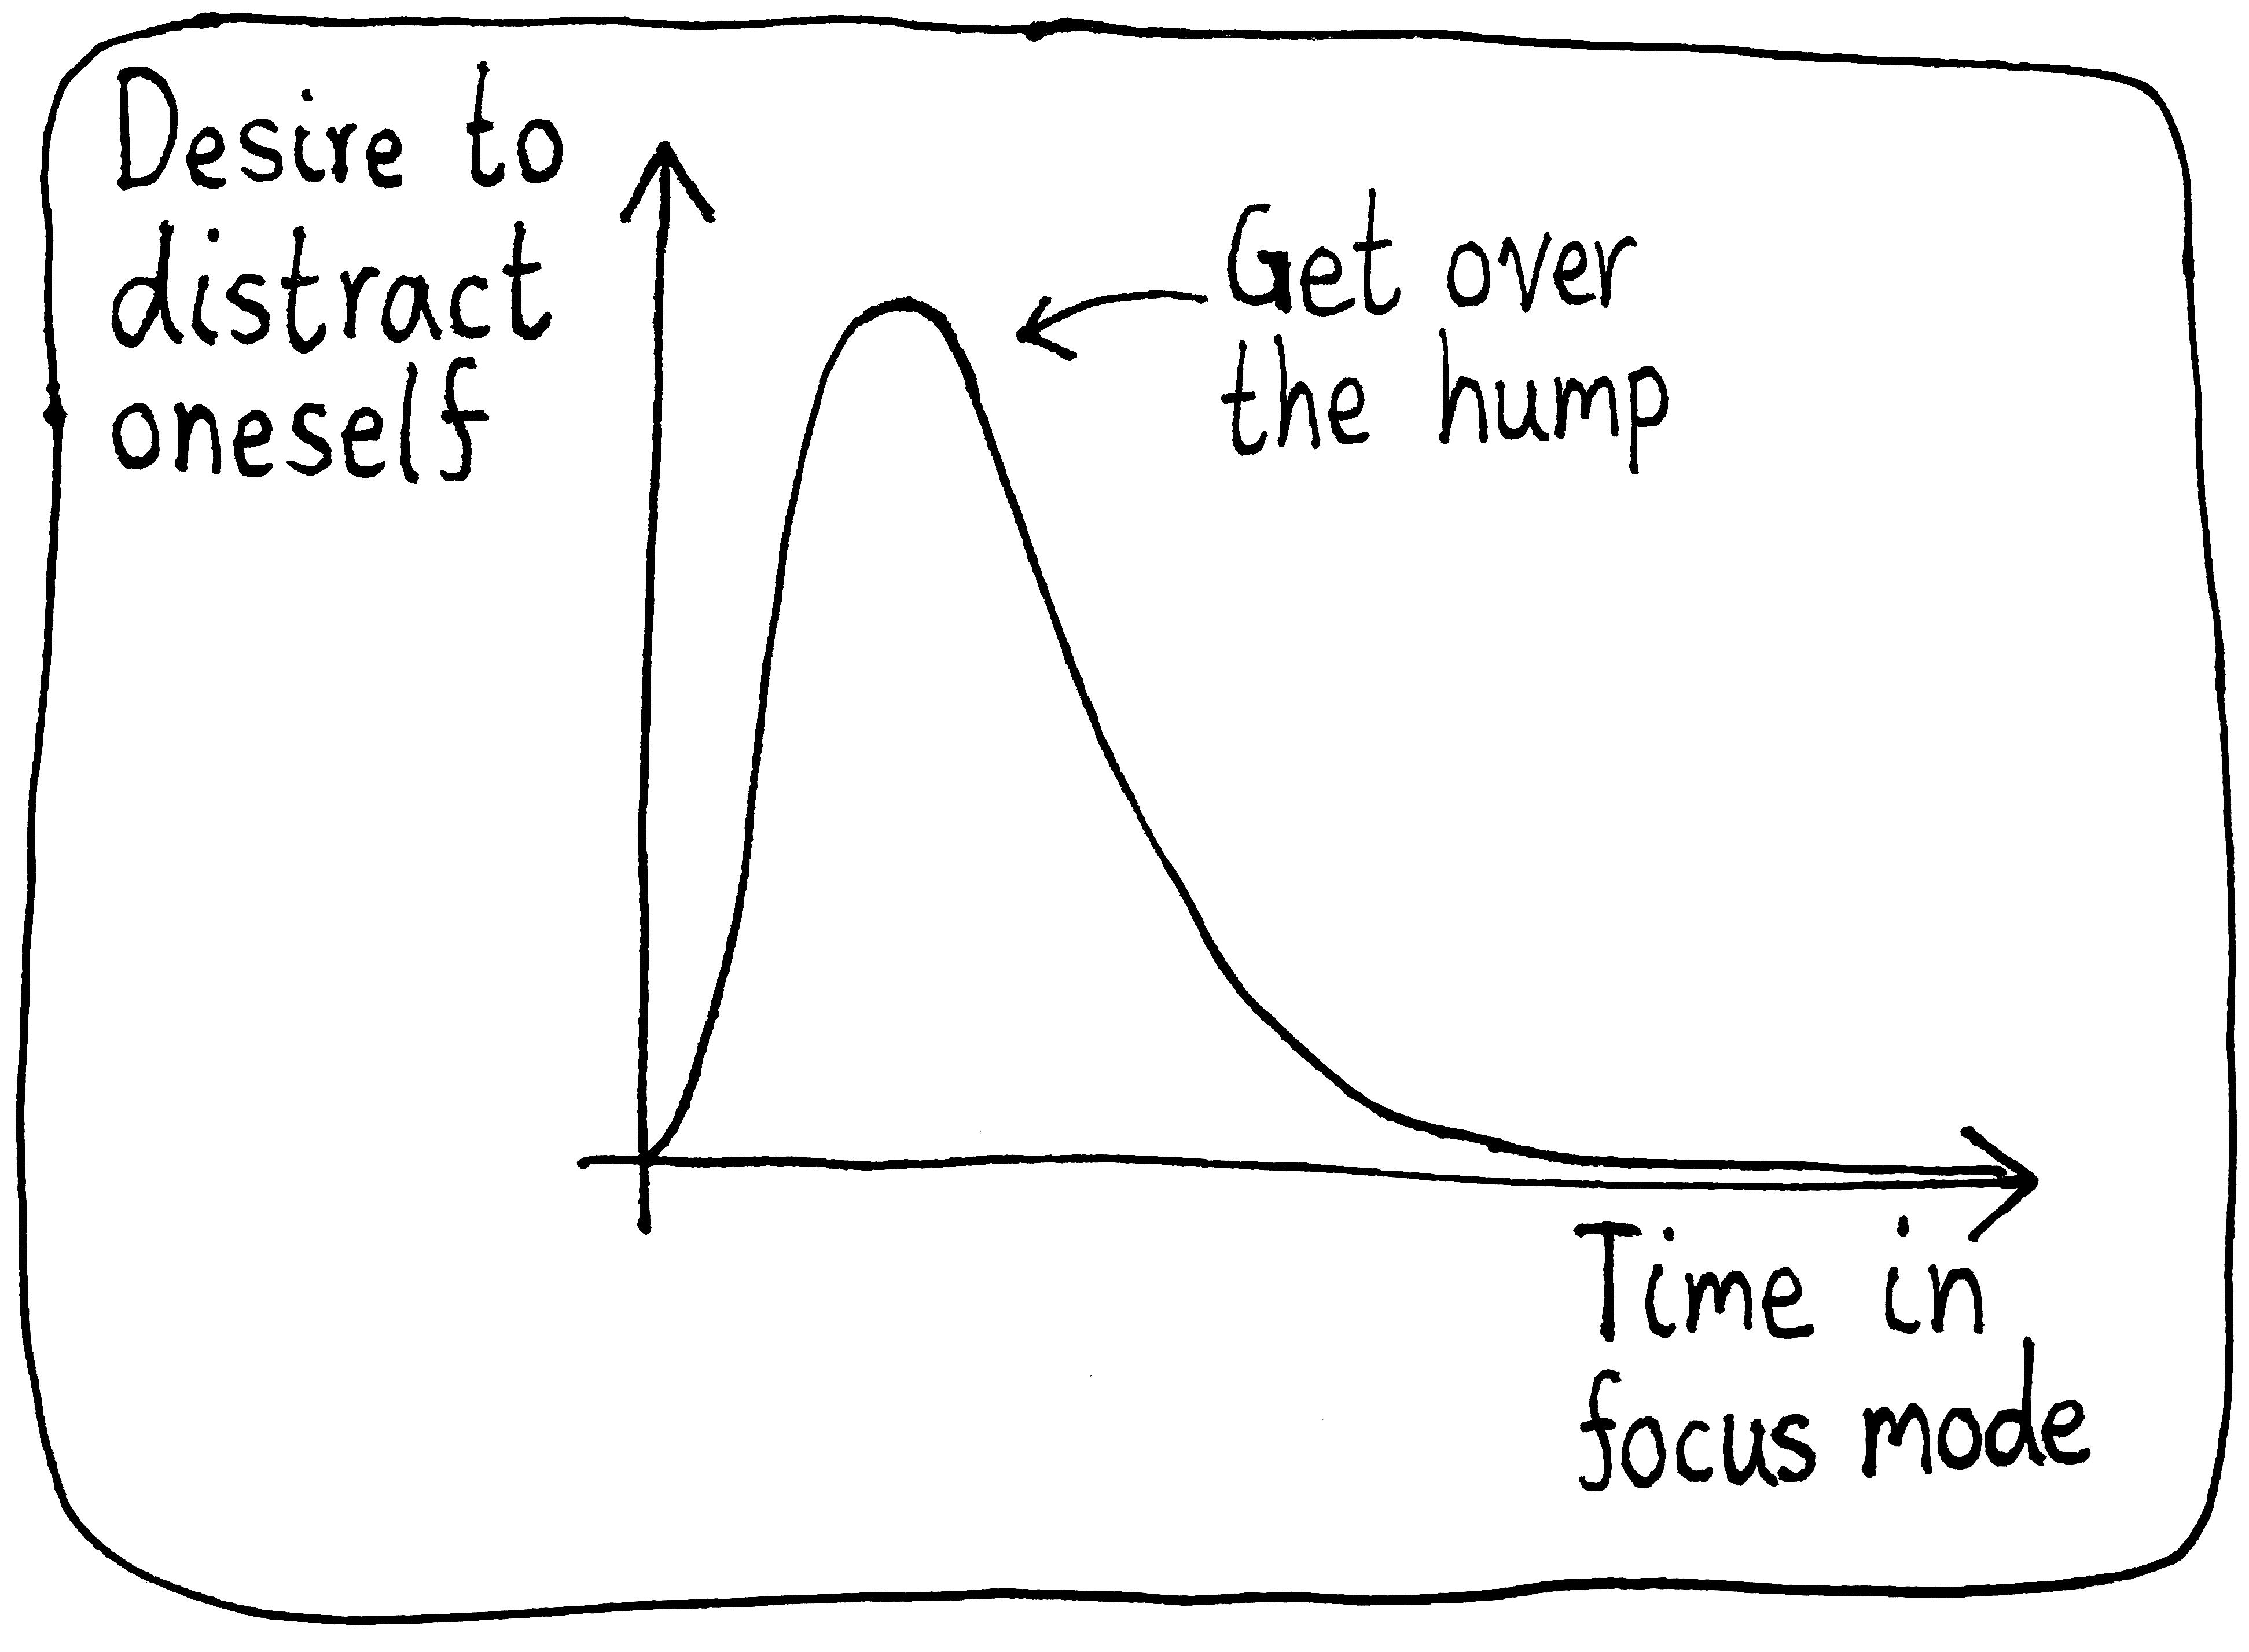
Unfortunately, giving in to a distraction doesn’t pause your way through the curve, but resets you back to zero.
01 Mar 2025