 Comics about mathematics, science, and the student life.
Retention
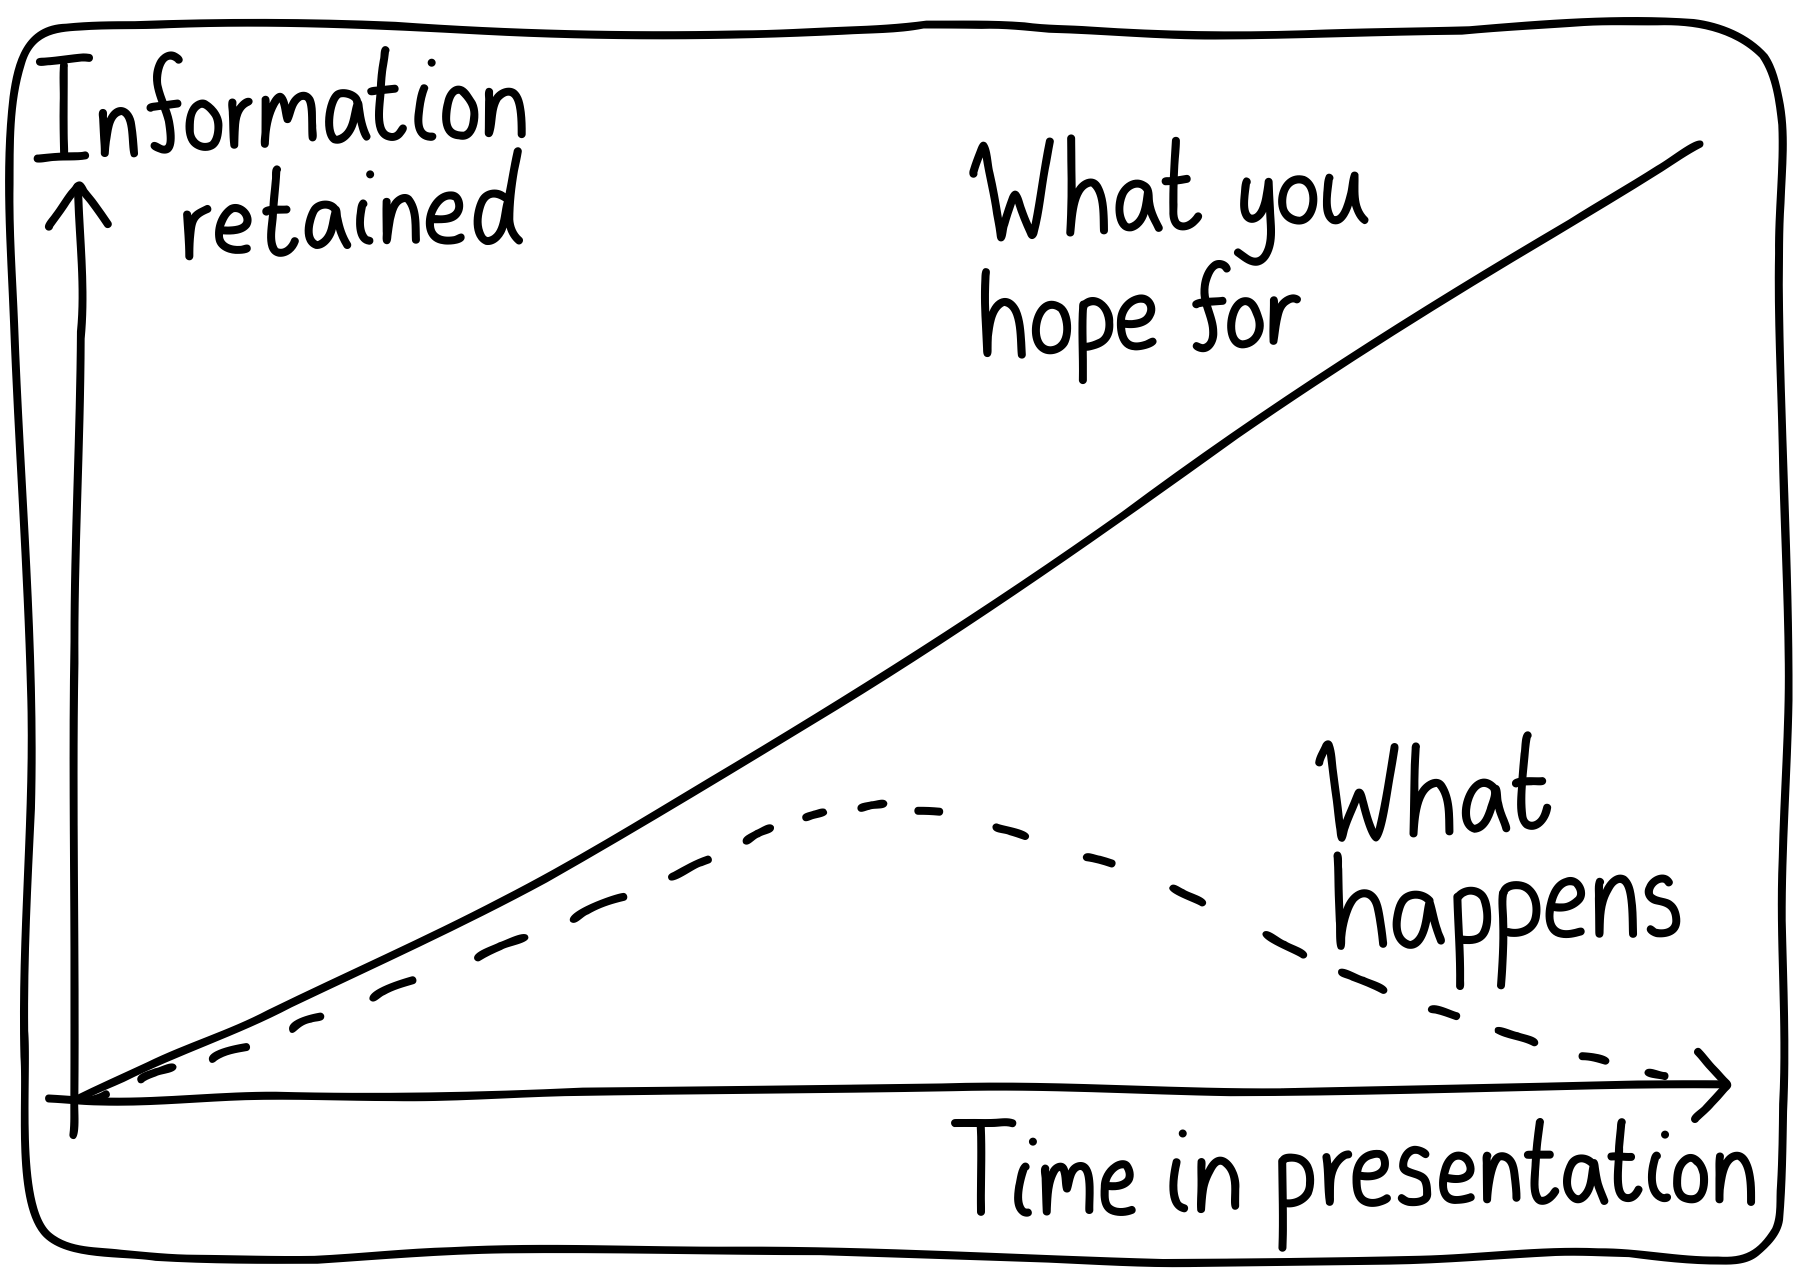
Two reasons: working memory overload and fatigue. It’s a fantasy to imagine that my audience will immediately soak up everything I share.
Published on March 22nd , 2025 by Jeremy