 Comics about mathematics, science, and the student life.
Editing

And as a corollary, the length of the email tends to decrease with editing. (As with this quote that inspired the comic.)
07 Apr 2023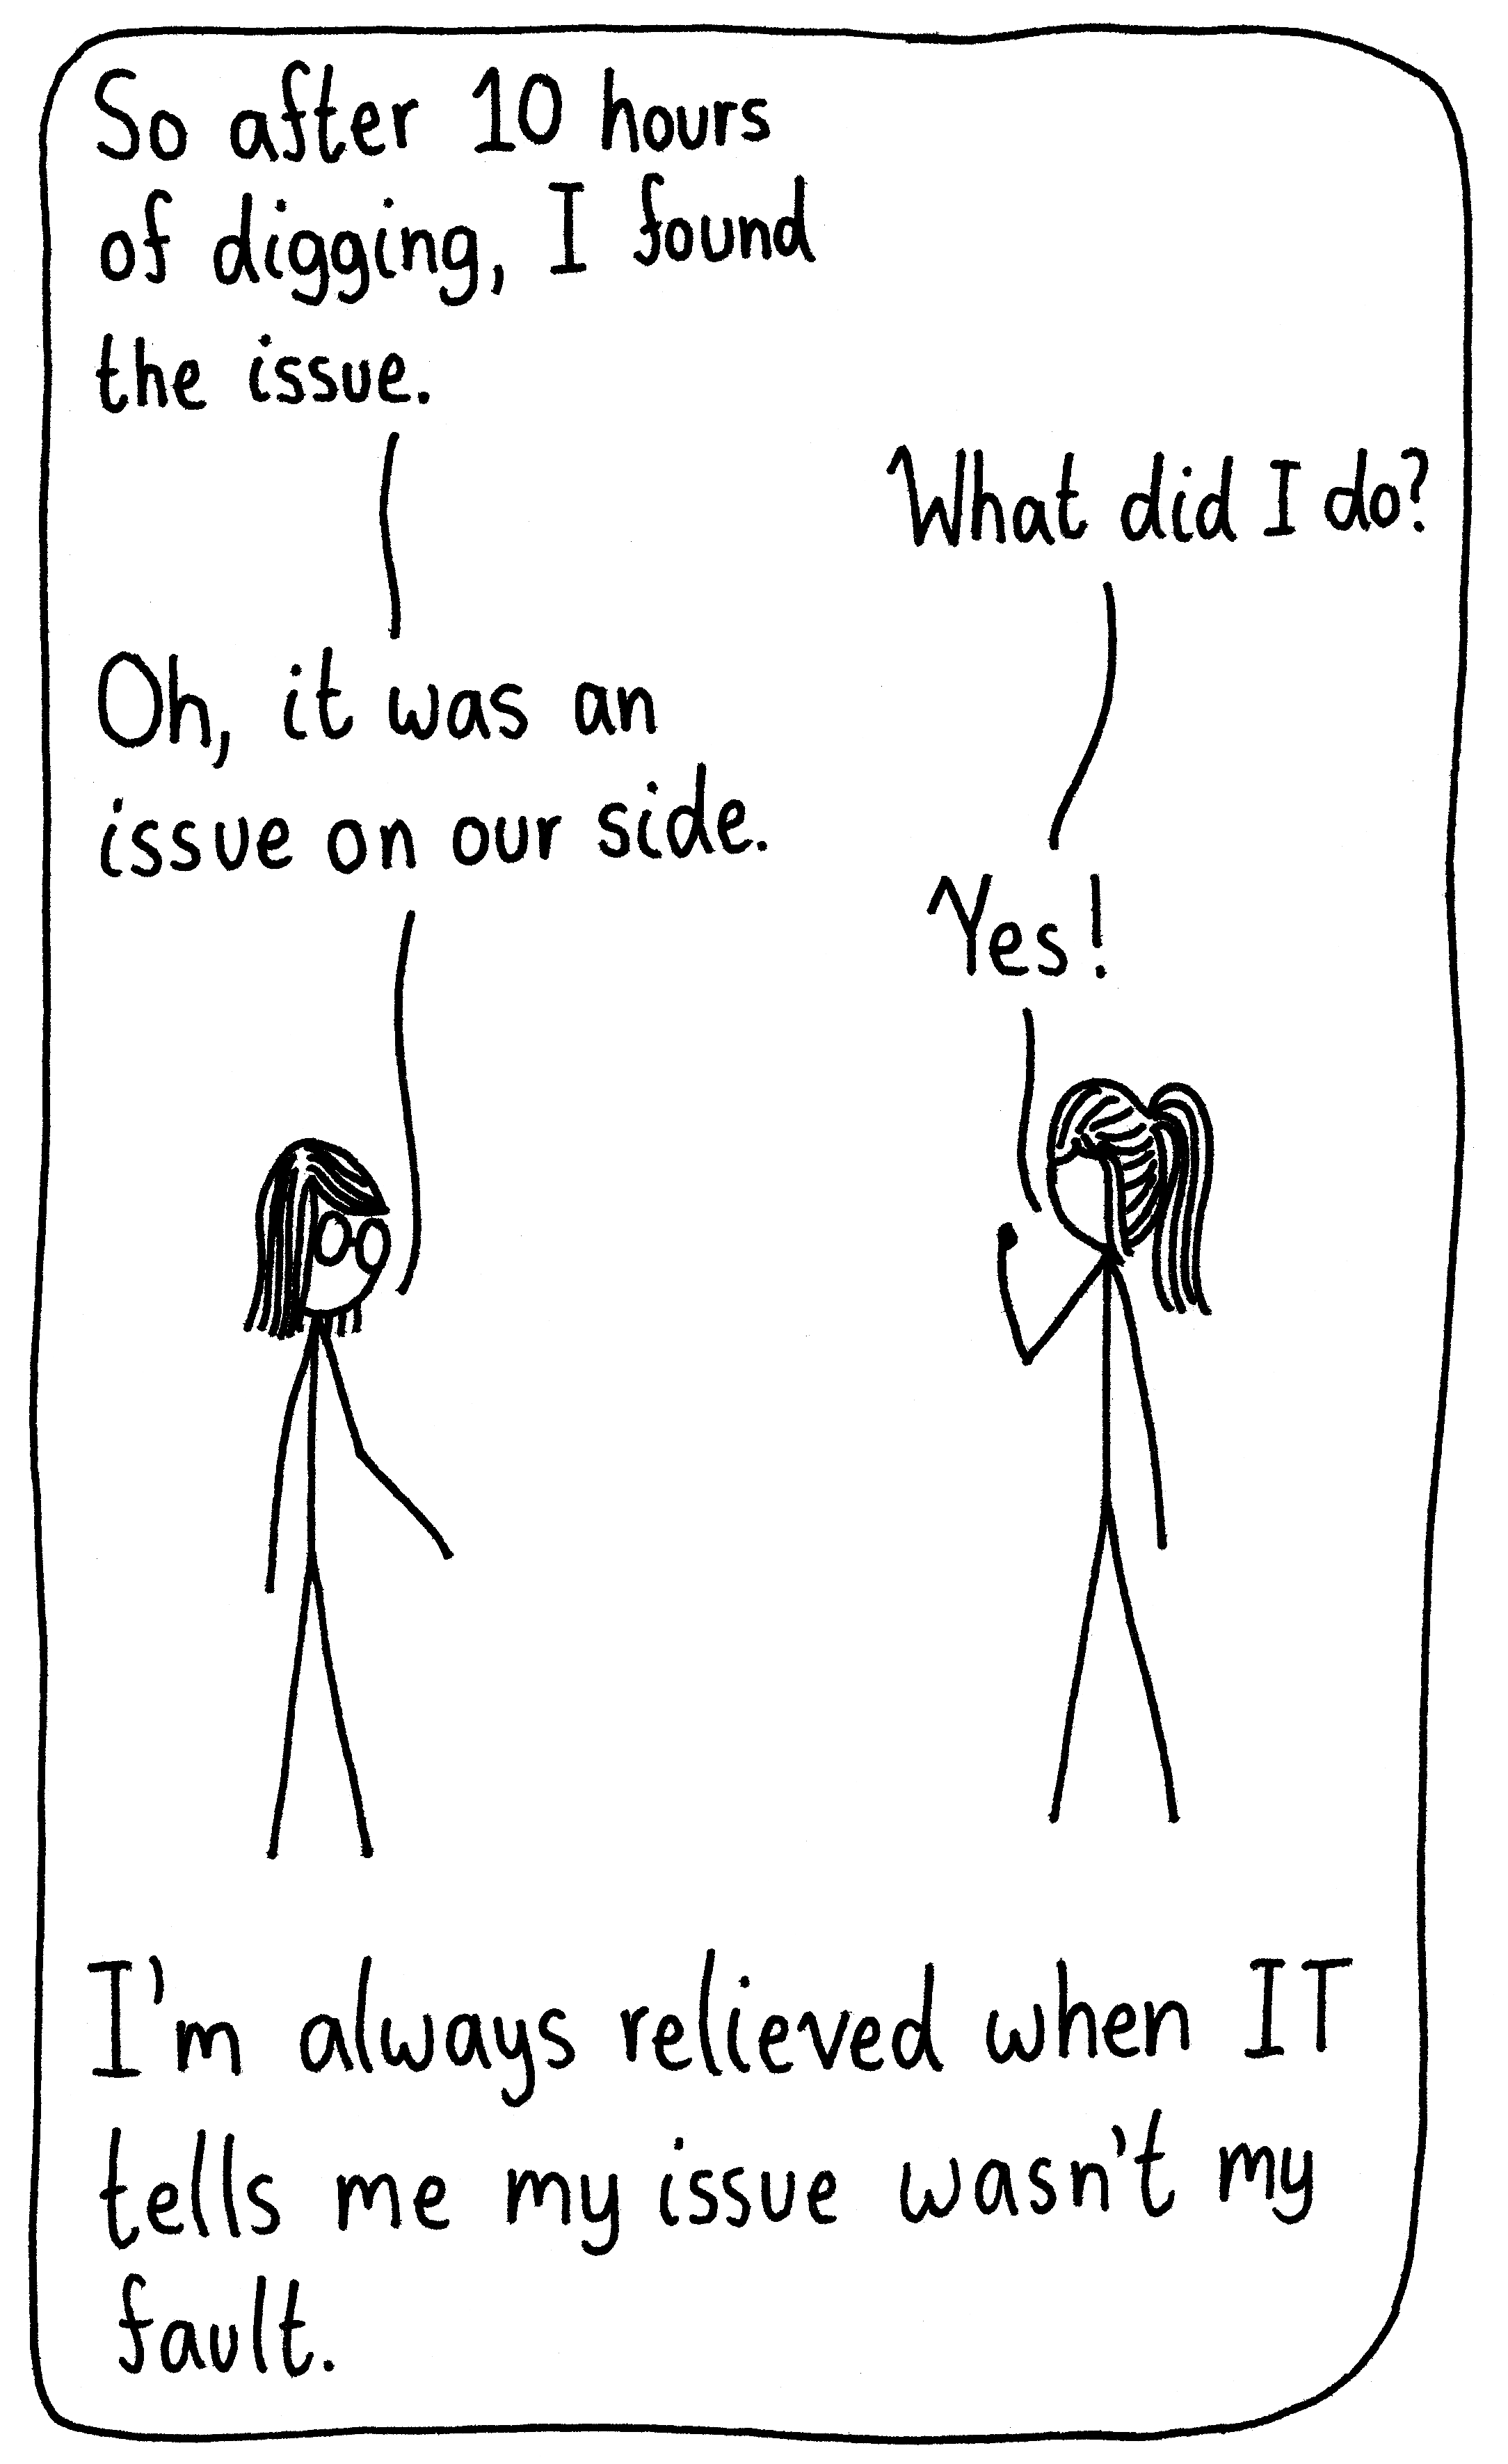

Conference Attendance
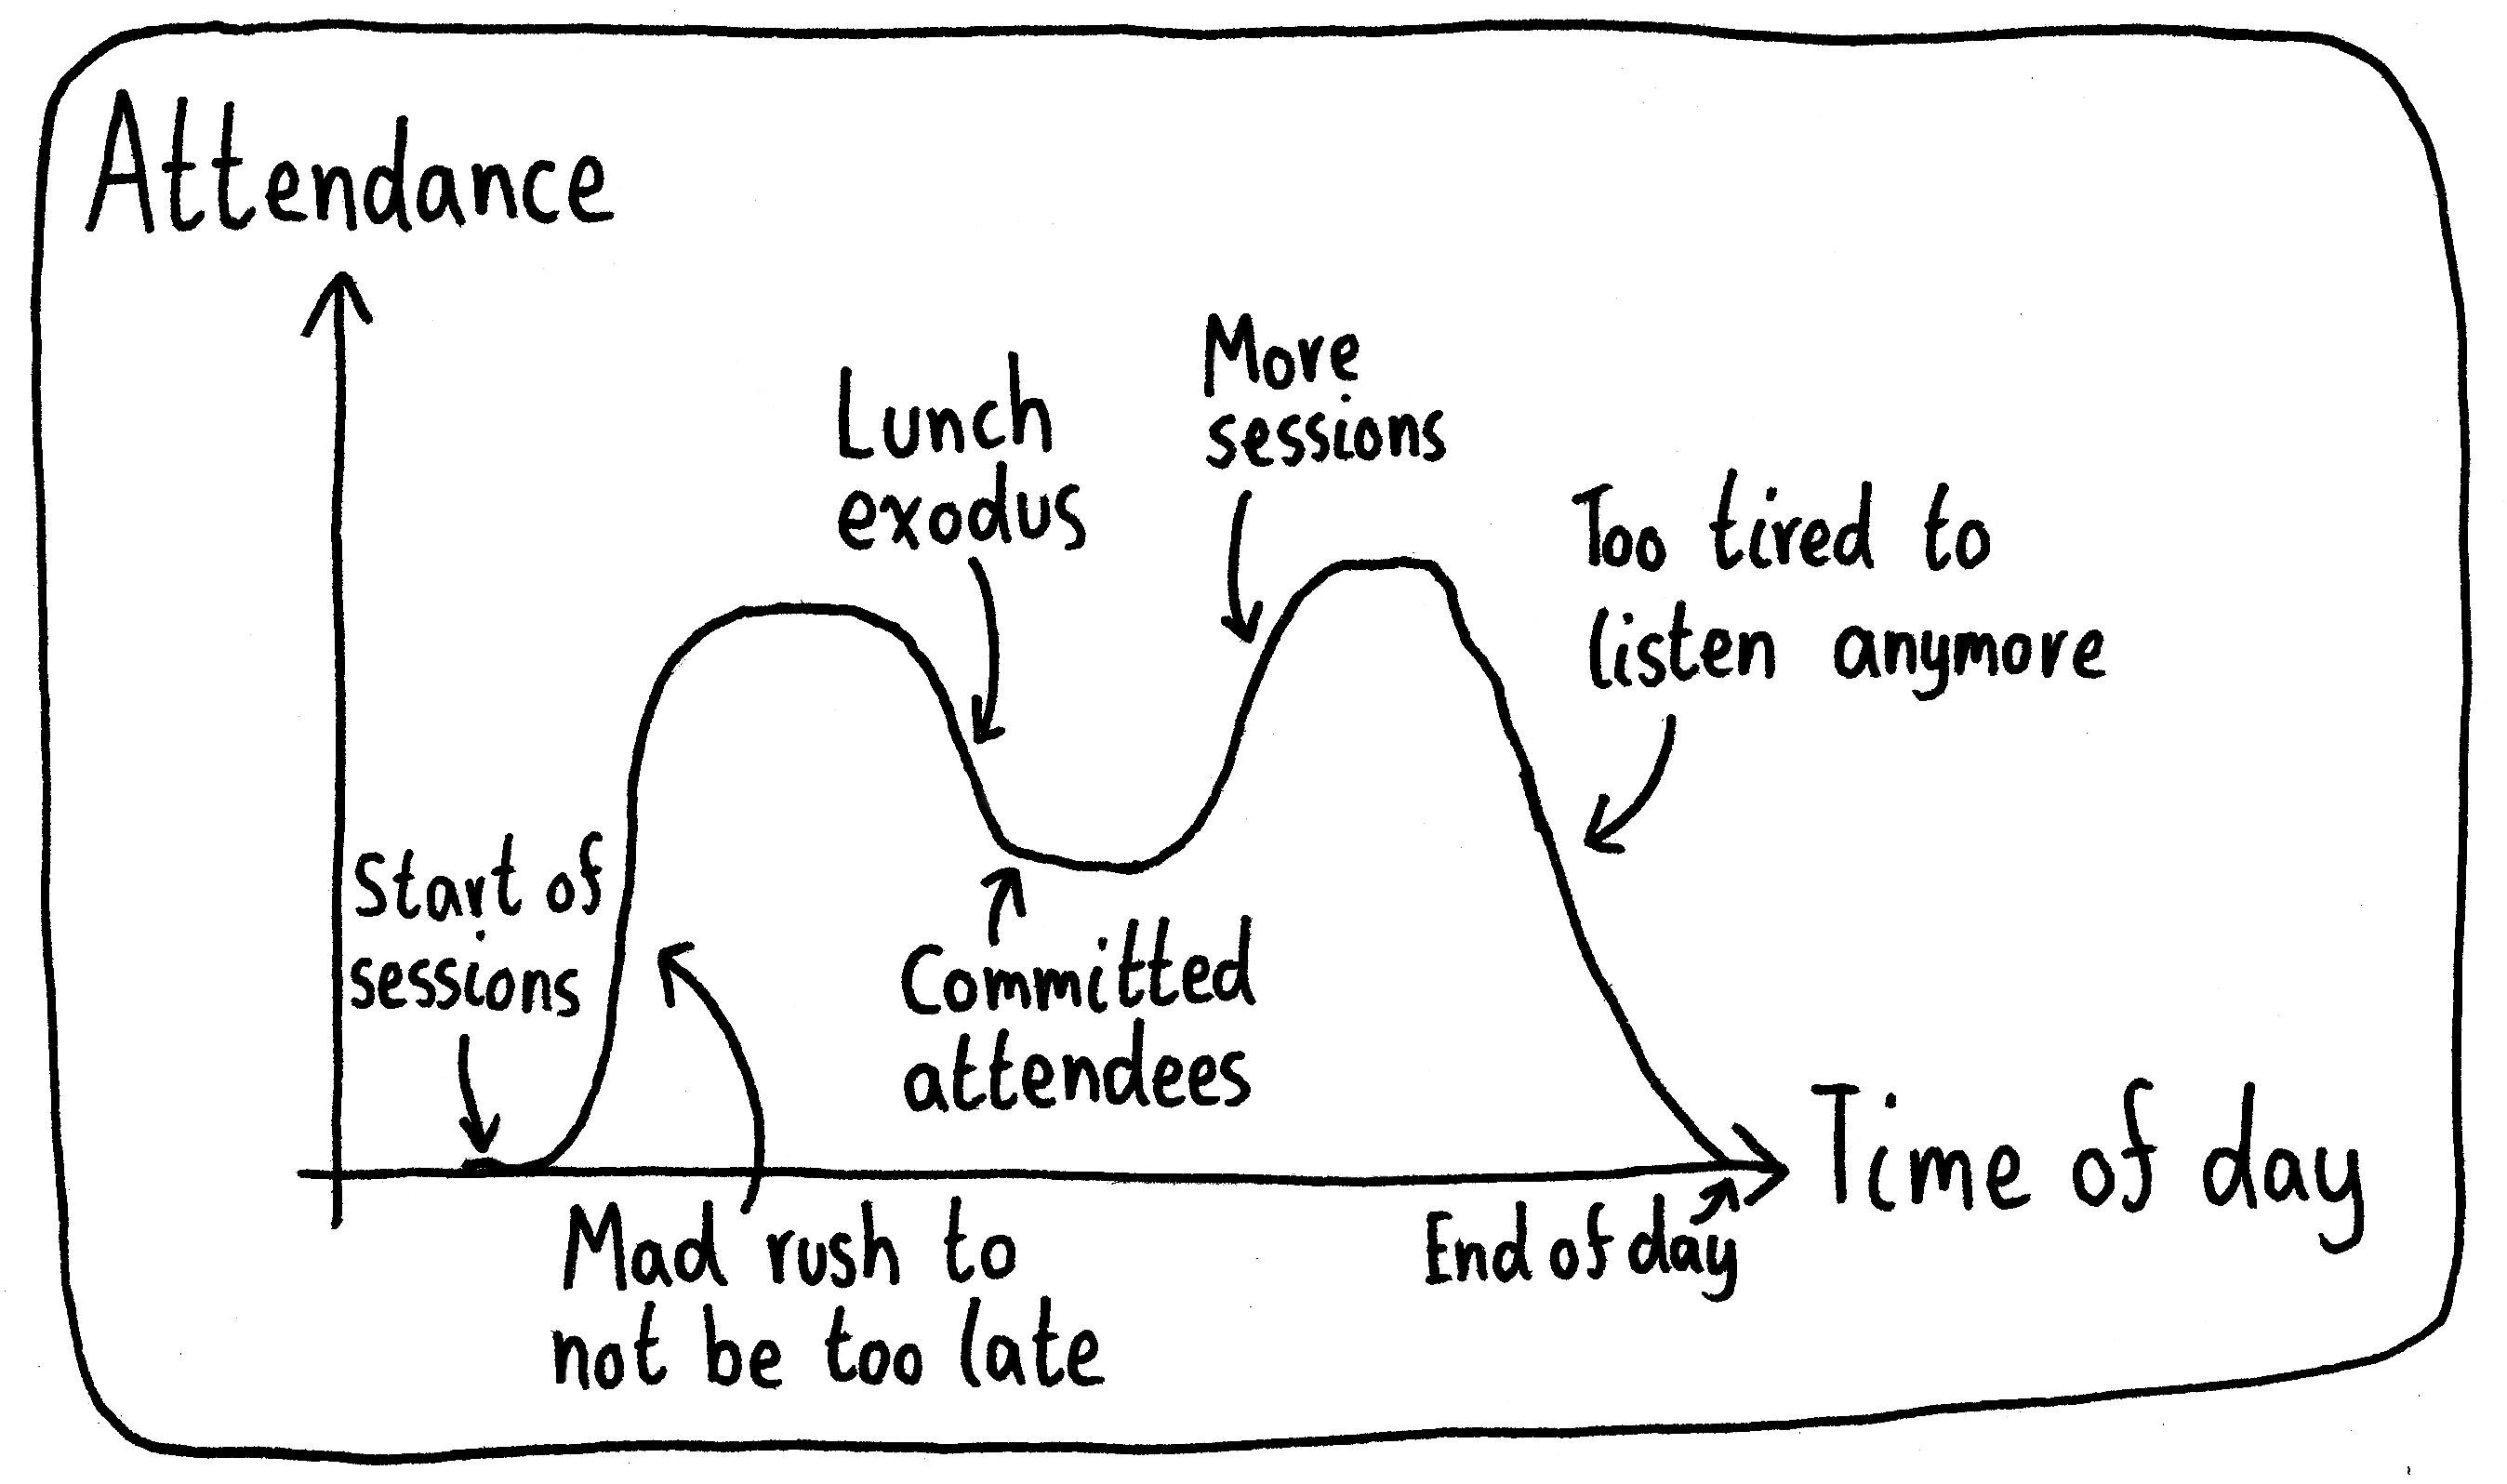
This happens on a macro level too: As I attend more days of a conference, I lose the initial stamina I had to listen to many presentations.
31 Mar 2023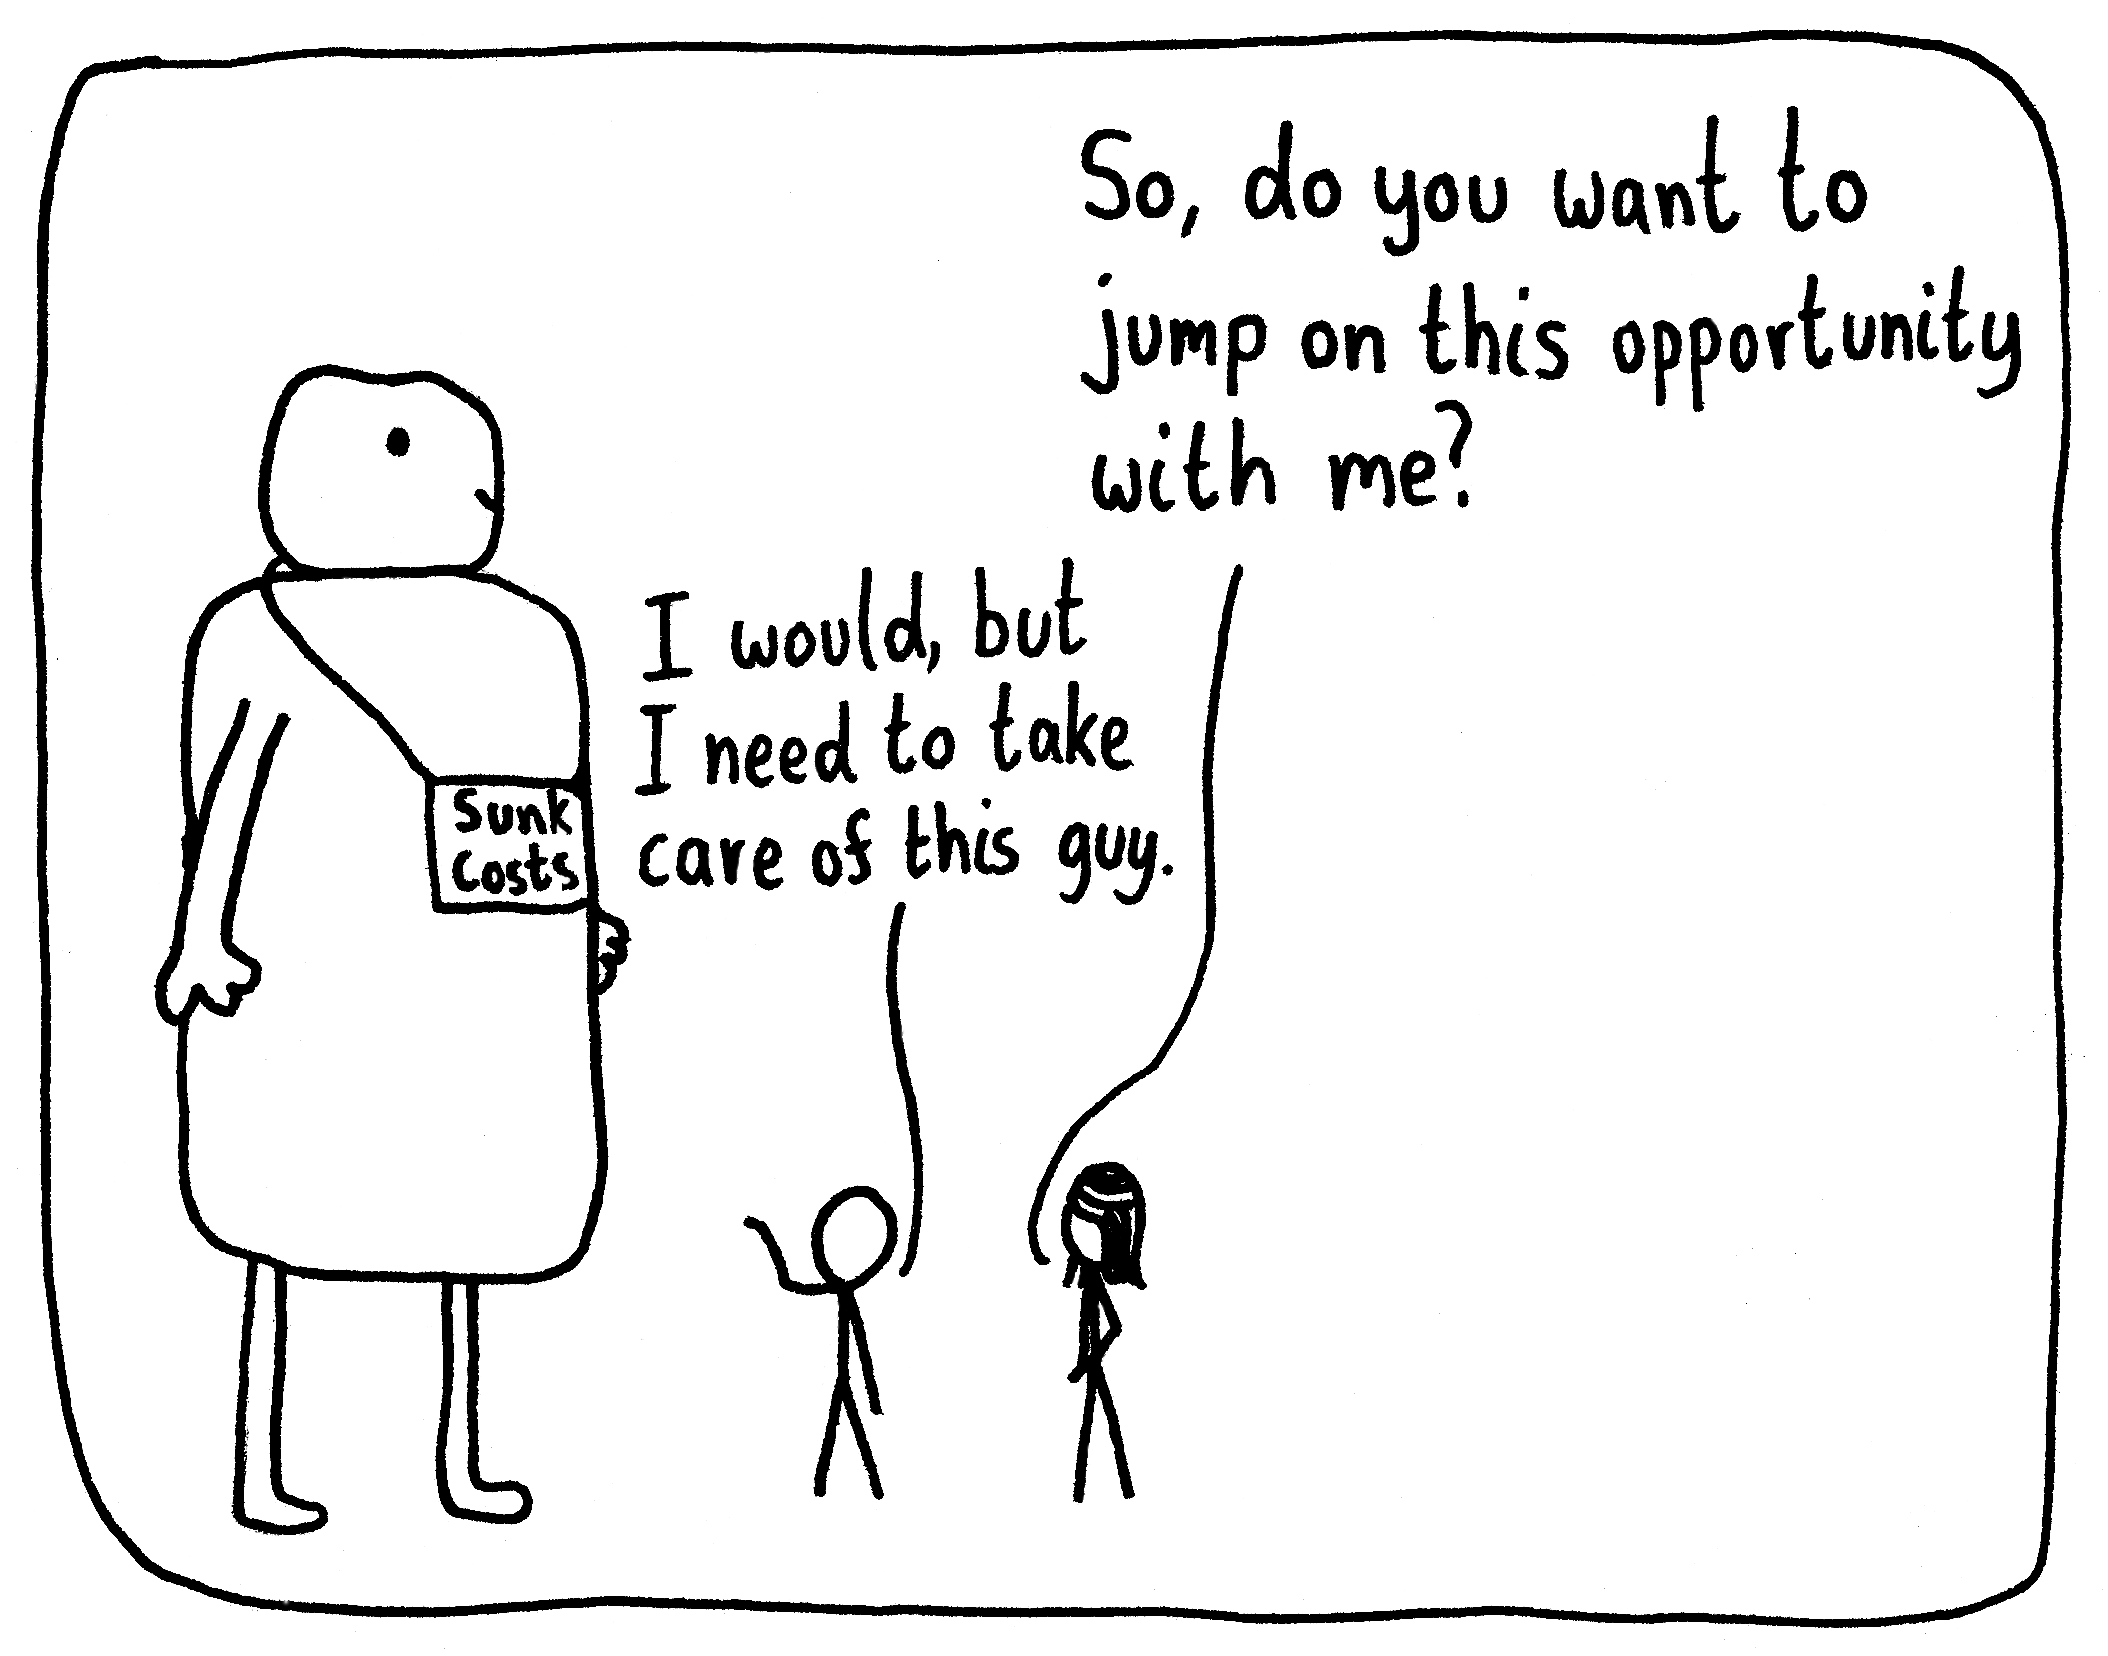
How to Cook With Quantum
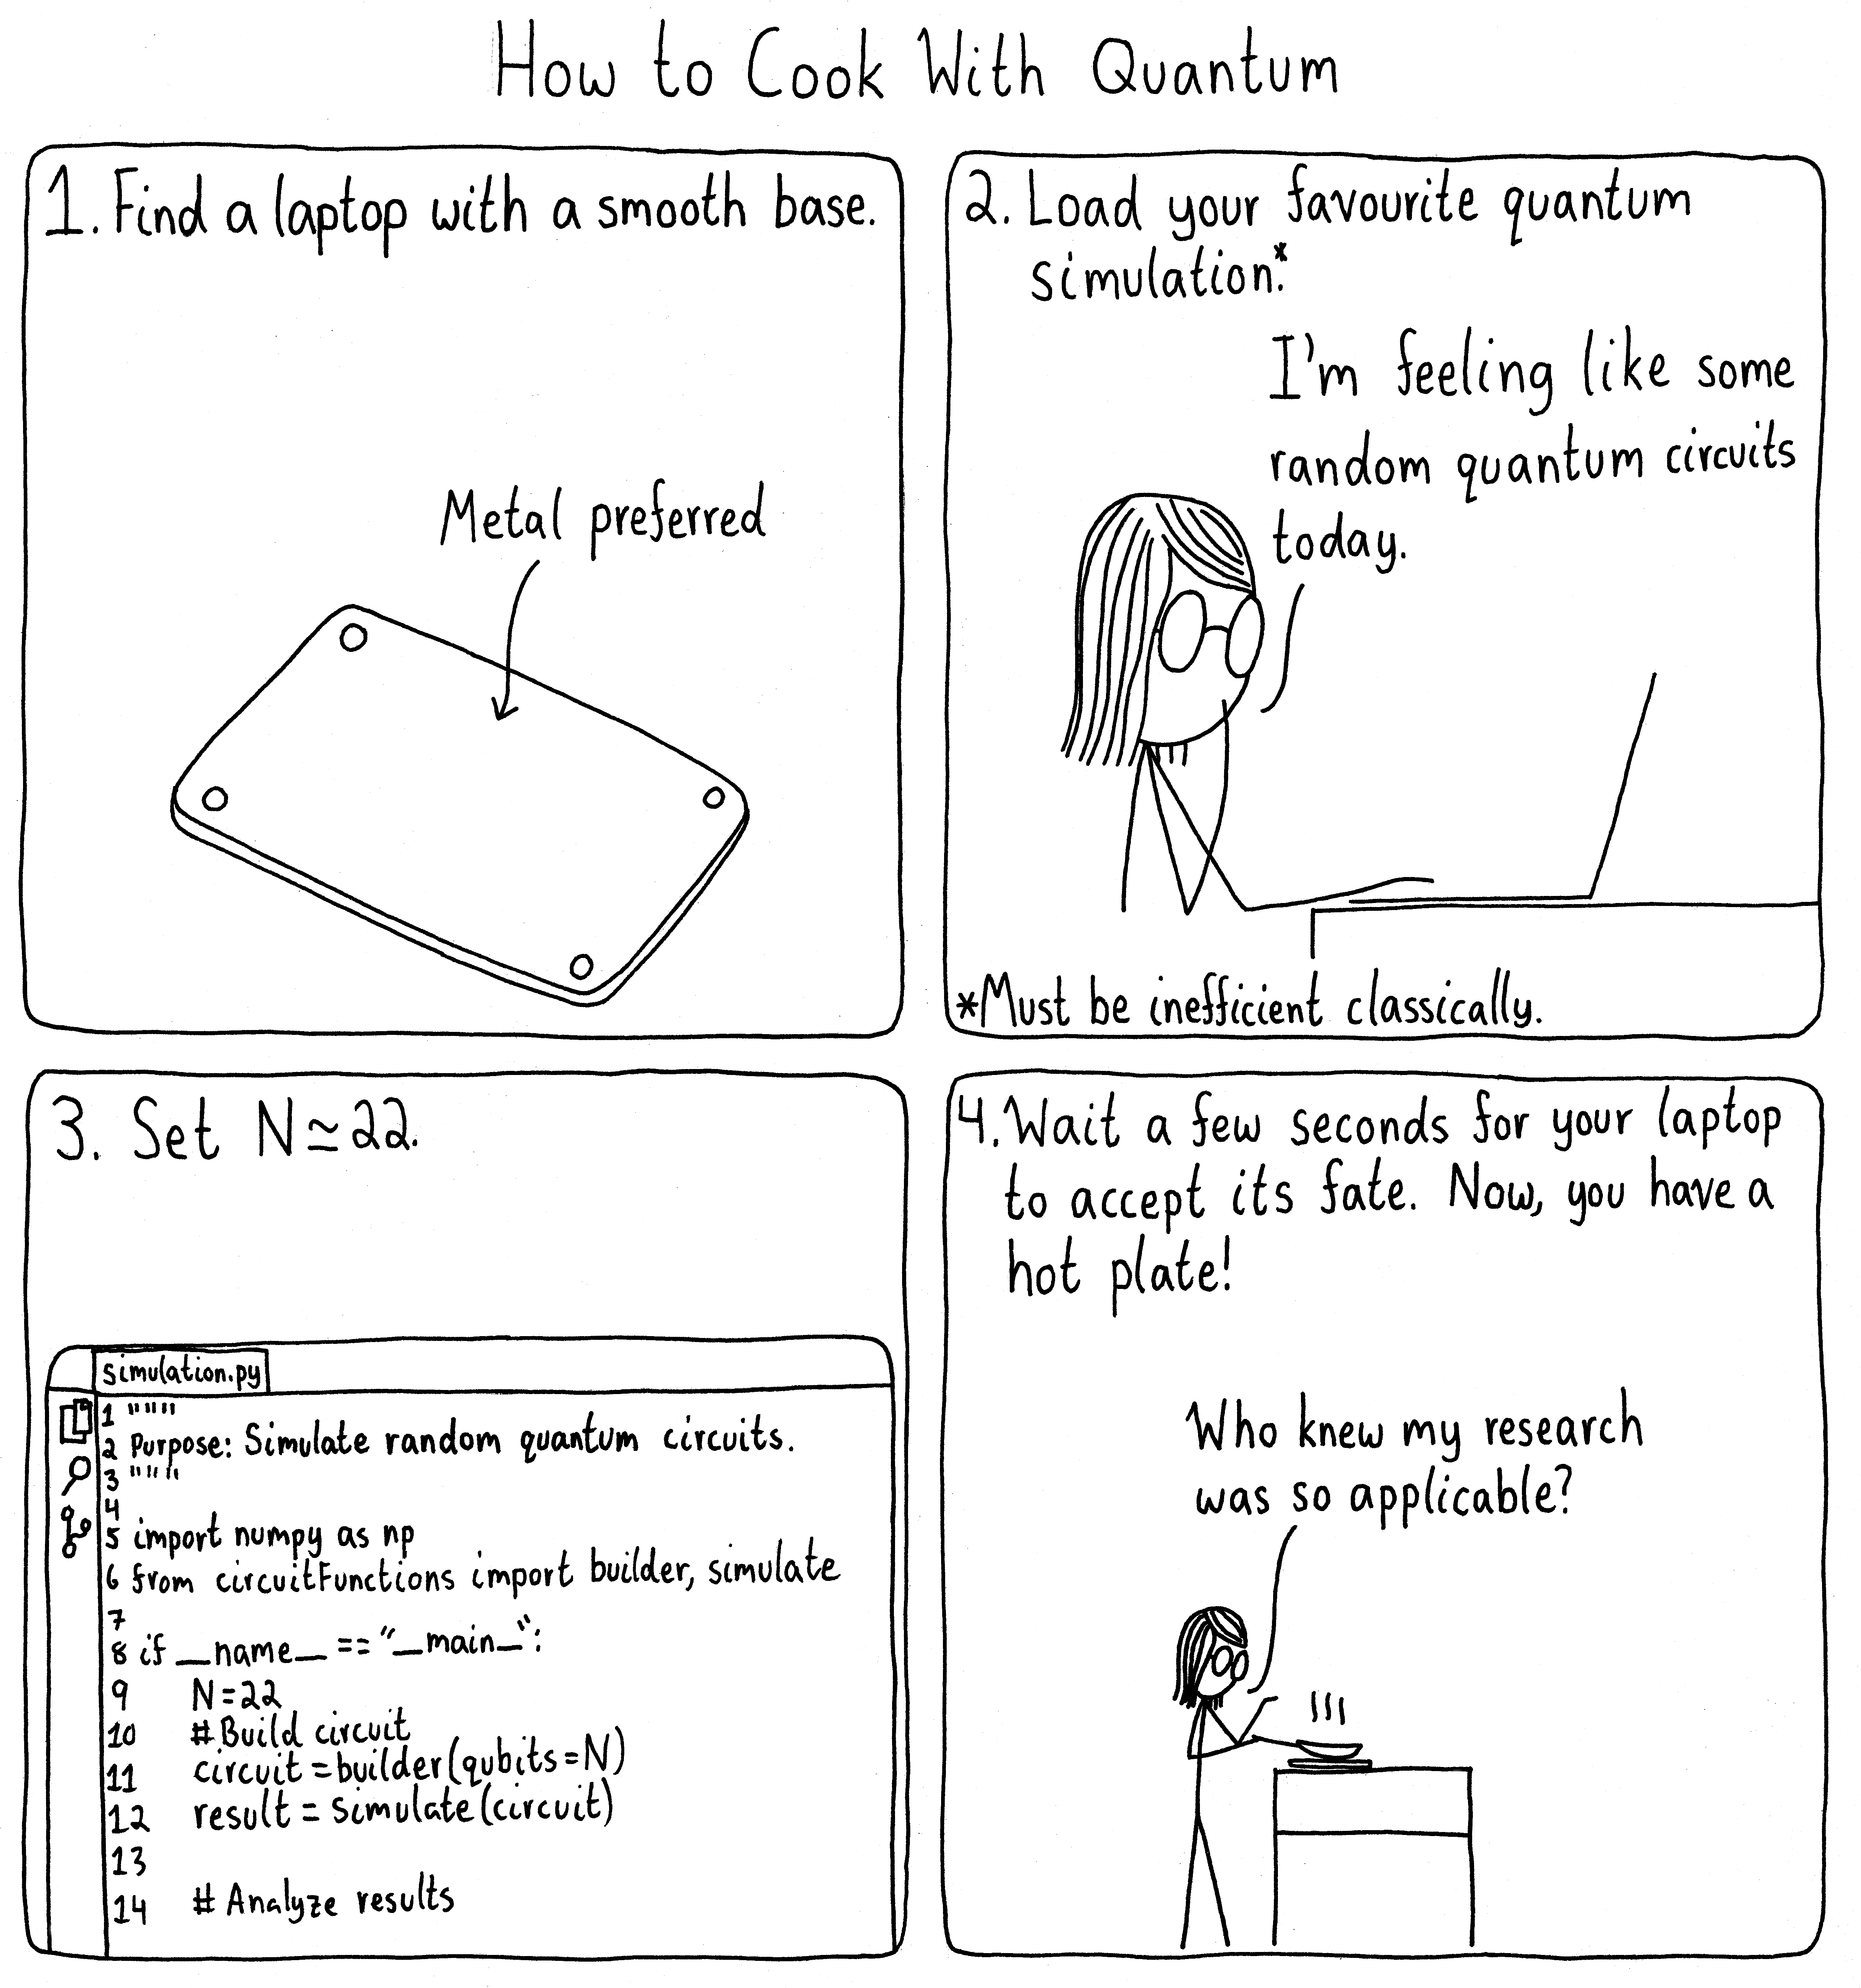
This is going in my next grant application.
(Hat tip to Andrea Morello for the inspiration.)
27 Mar 2023
Sliver of Context

I try to remember this whenever I’m tempted to get frustrated with athletes or students. I’m only privy to a small slice of their life, so I’m likely missing the surrounding context.
22 Mar 2023Growth in Safety
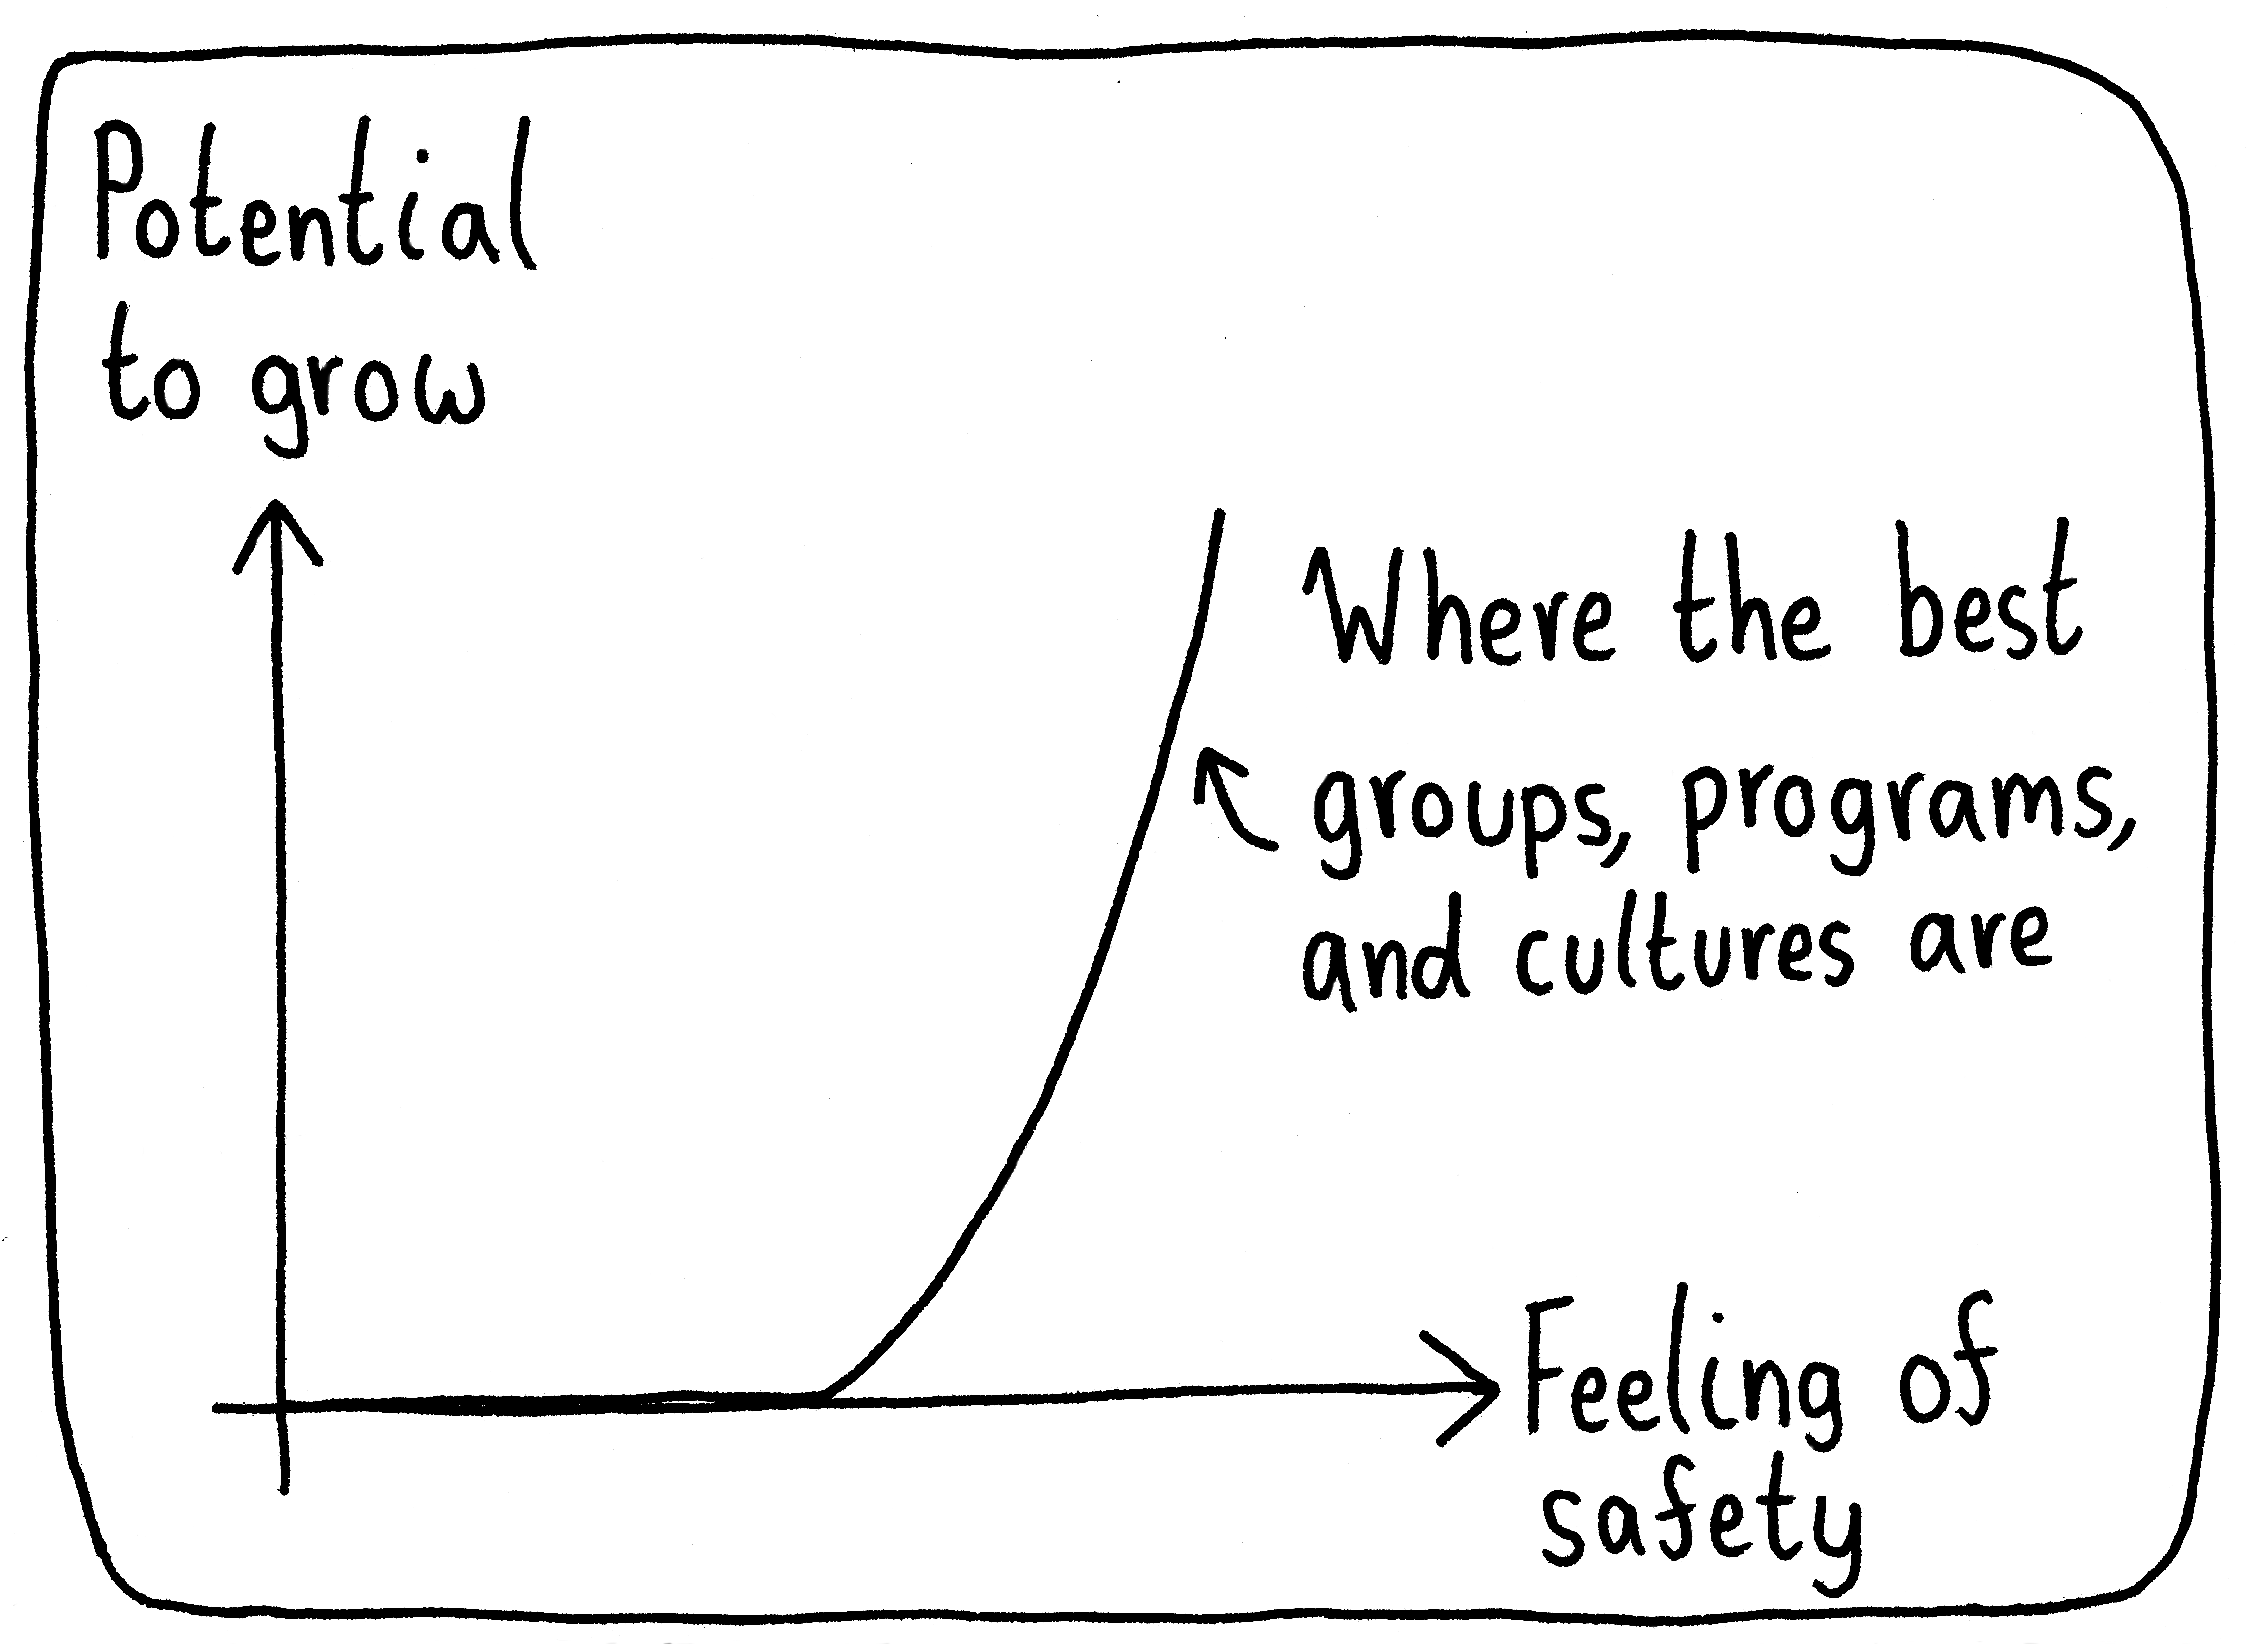
When I lead, this is one of my core responsibilities.
(Hat tip to Kiera for inspiring this graph!)
20 Mar 2023Internal
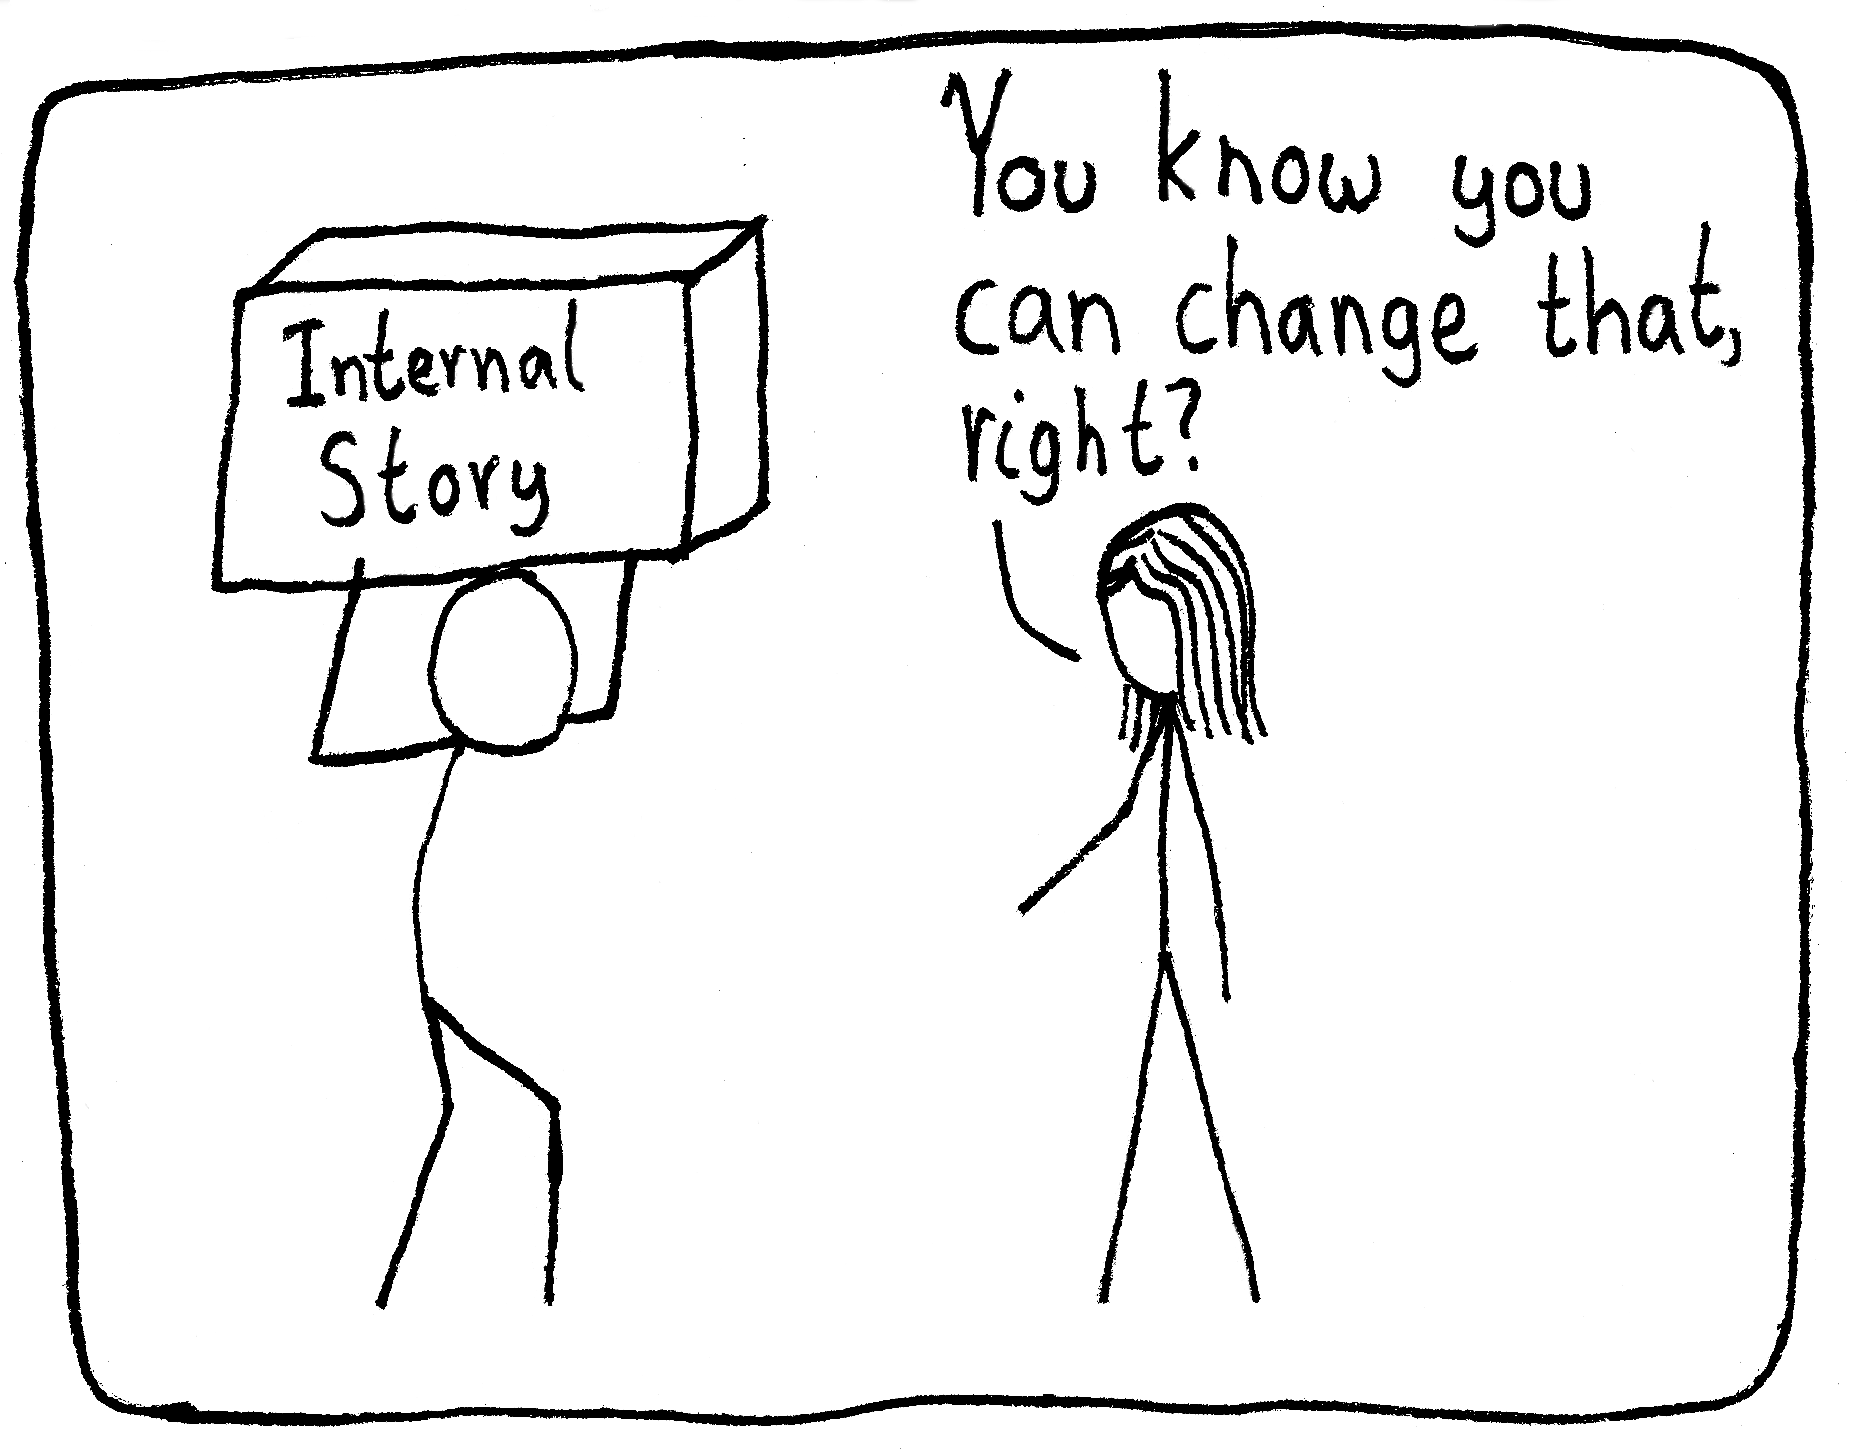
“You mean I should pick one of those instead?” he says, pointing behind to the pile of even larger boxes.
17 Mar 2023