 Comics about mathematics, science, and the student life.
Yes
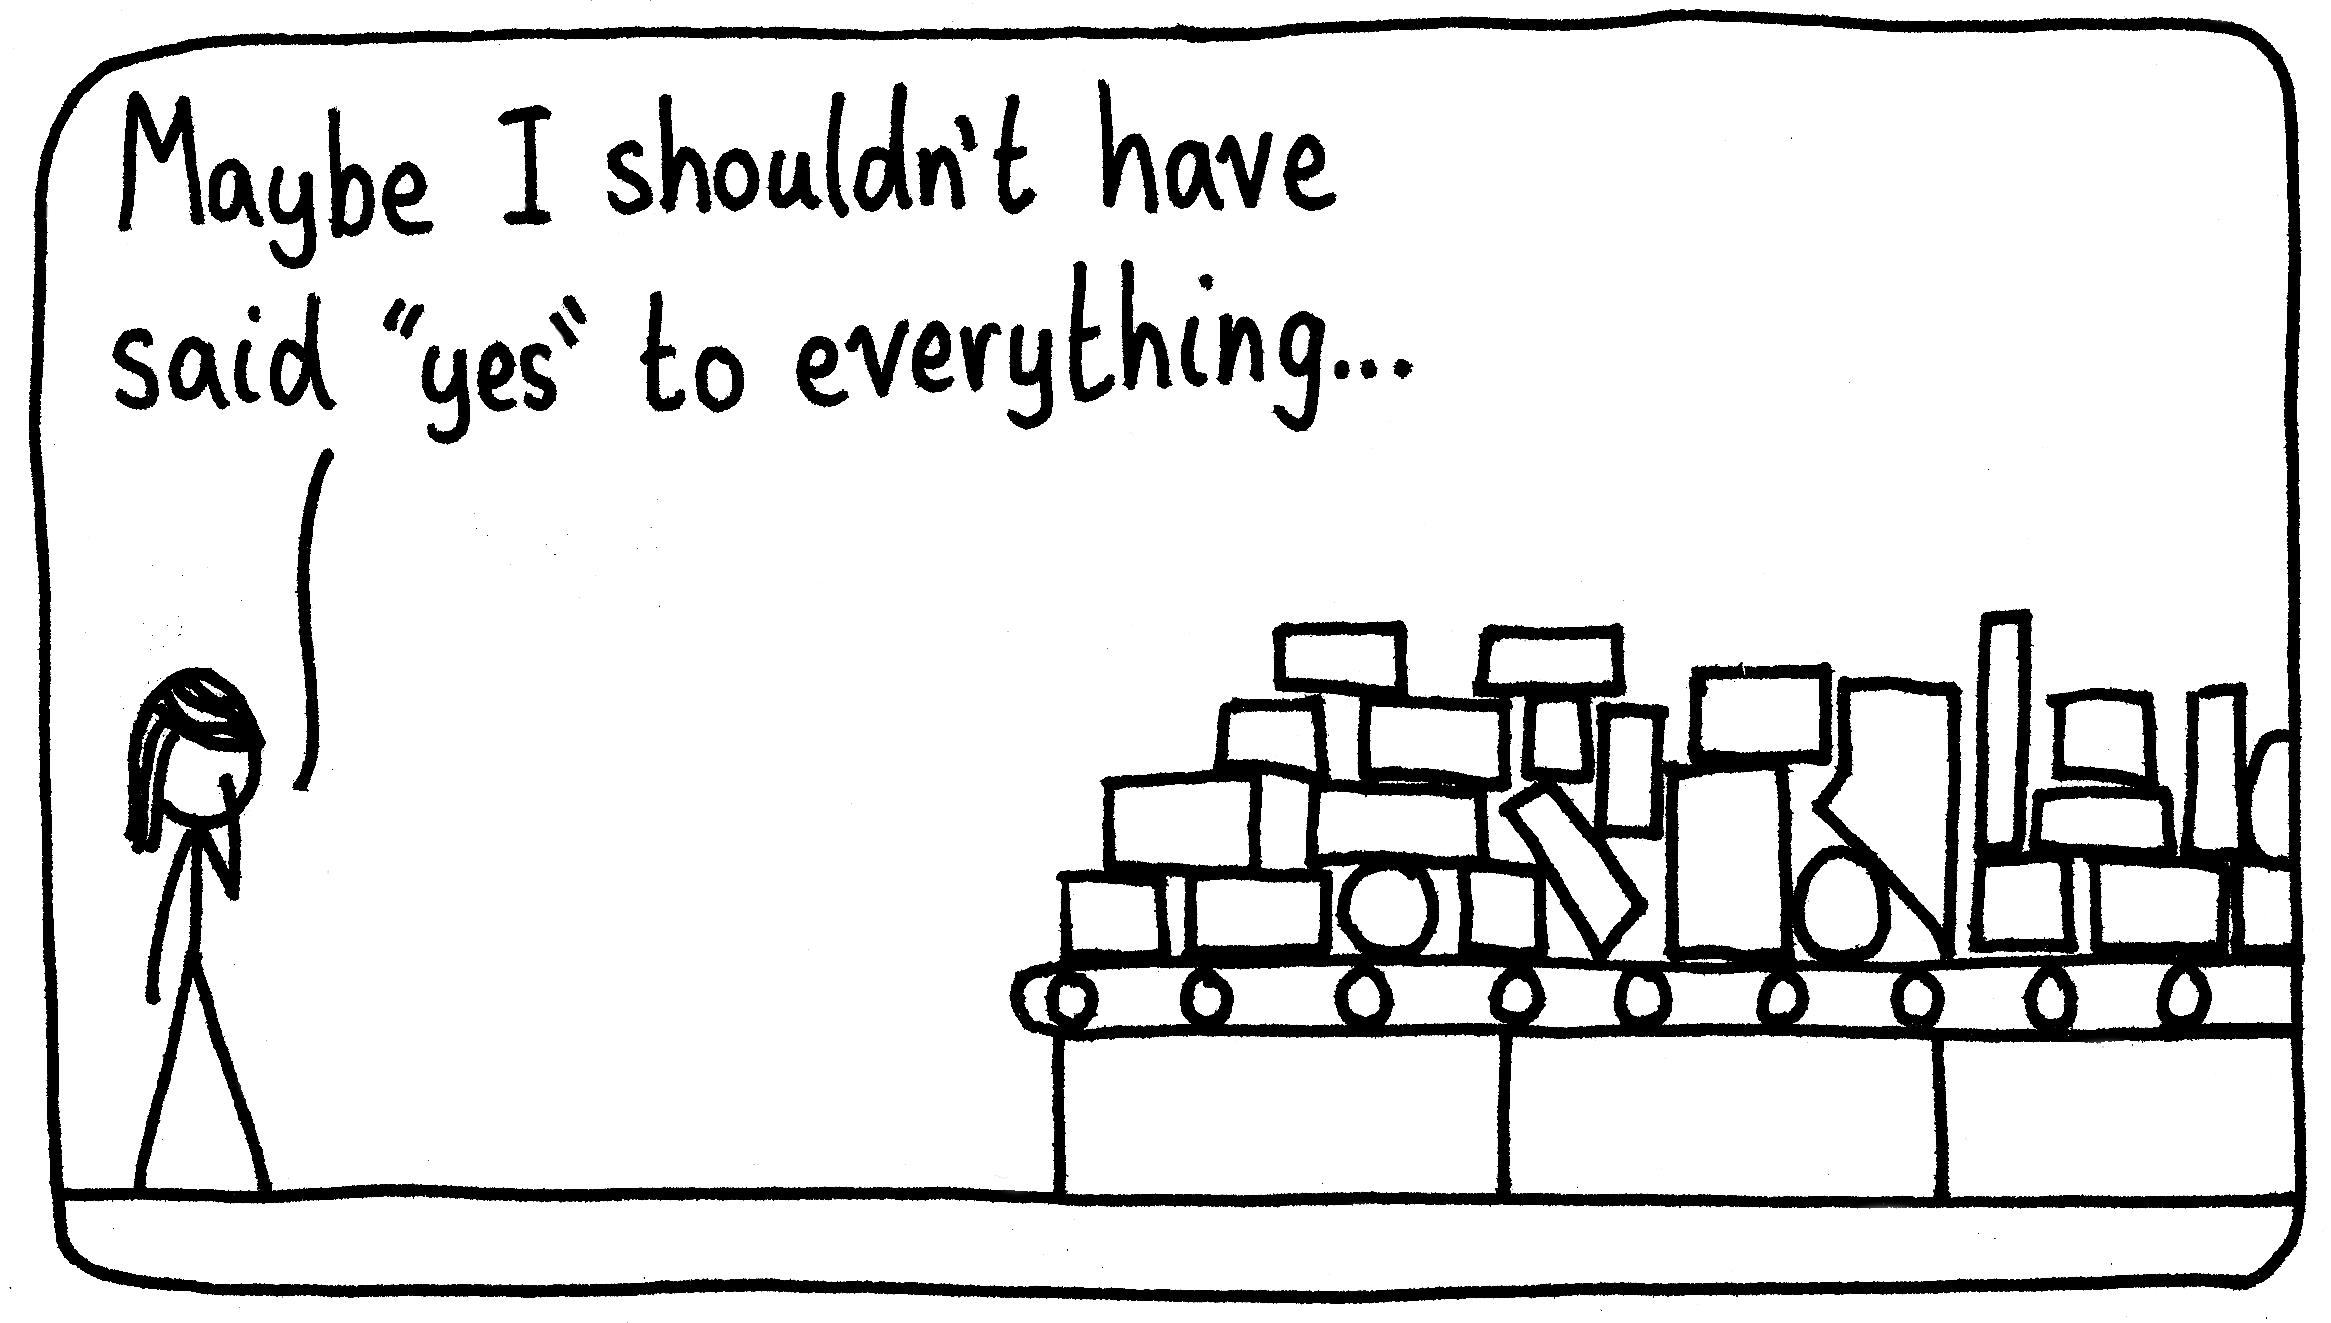
Actually, those are just the items from a few years ago that we really should be clearing out.
25 Aug 2023Scientific Writing

“Sorry, I can’t stay and chat about it. I have 10 other publications I’m working on right now.”
23 Aug 2023
Proximity
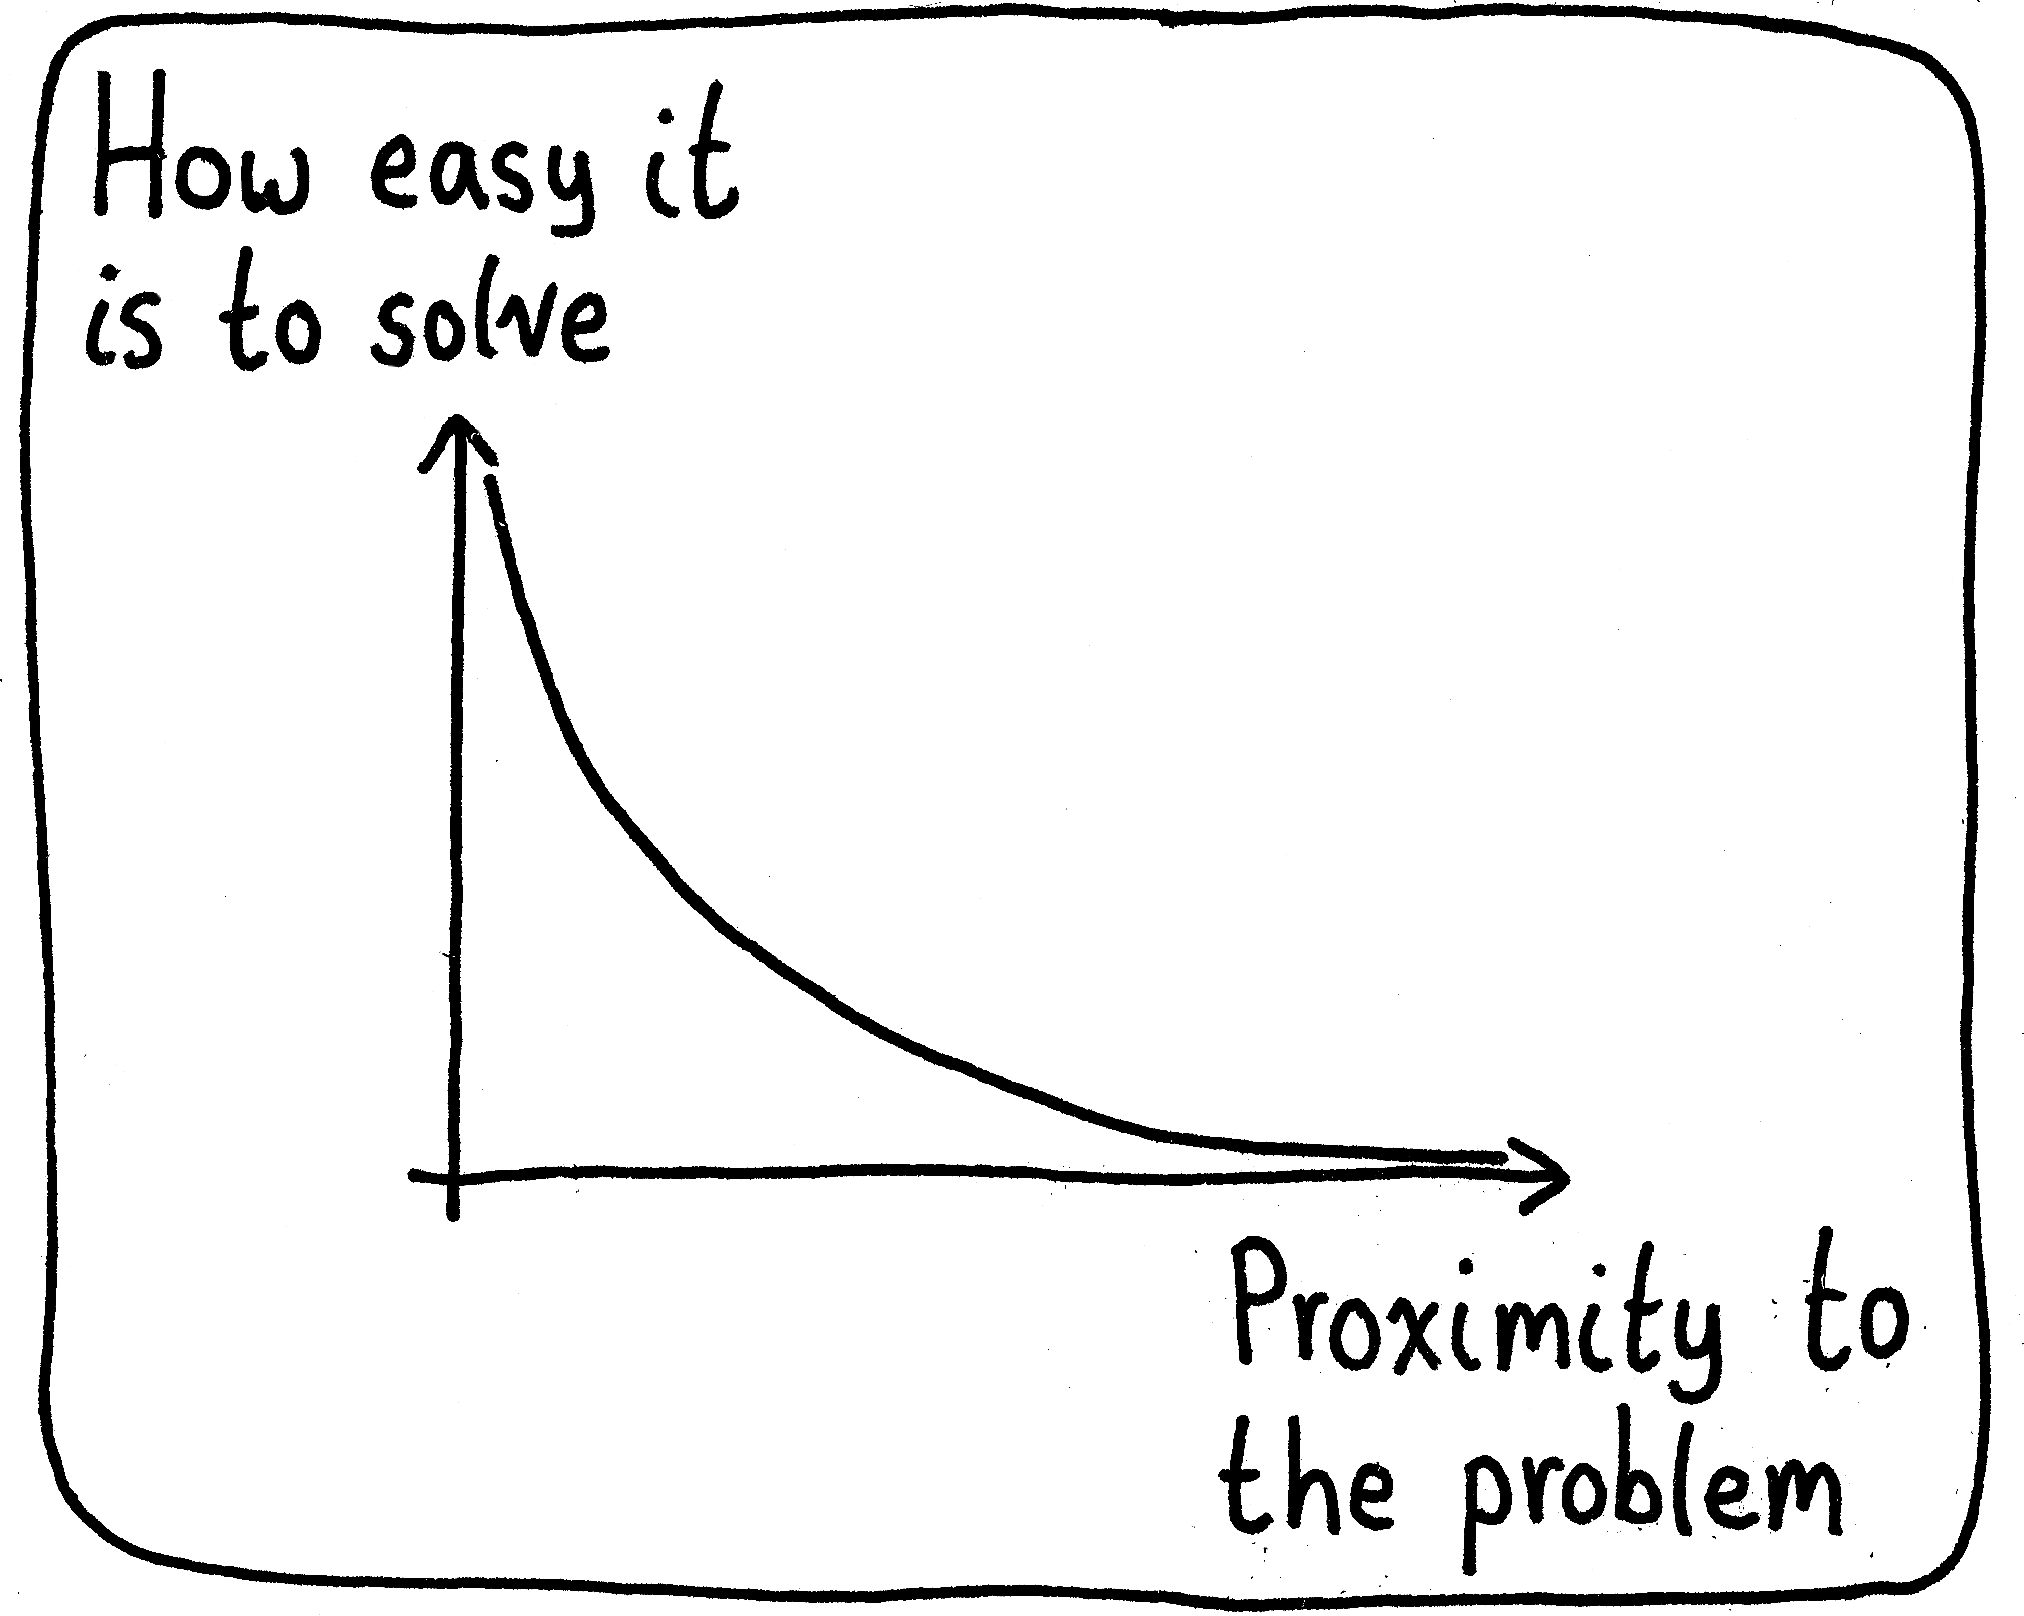
Without that emotional attachment, it sure is easy to prescribe what to do for others!
18 Aug 2023

Pivoting
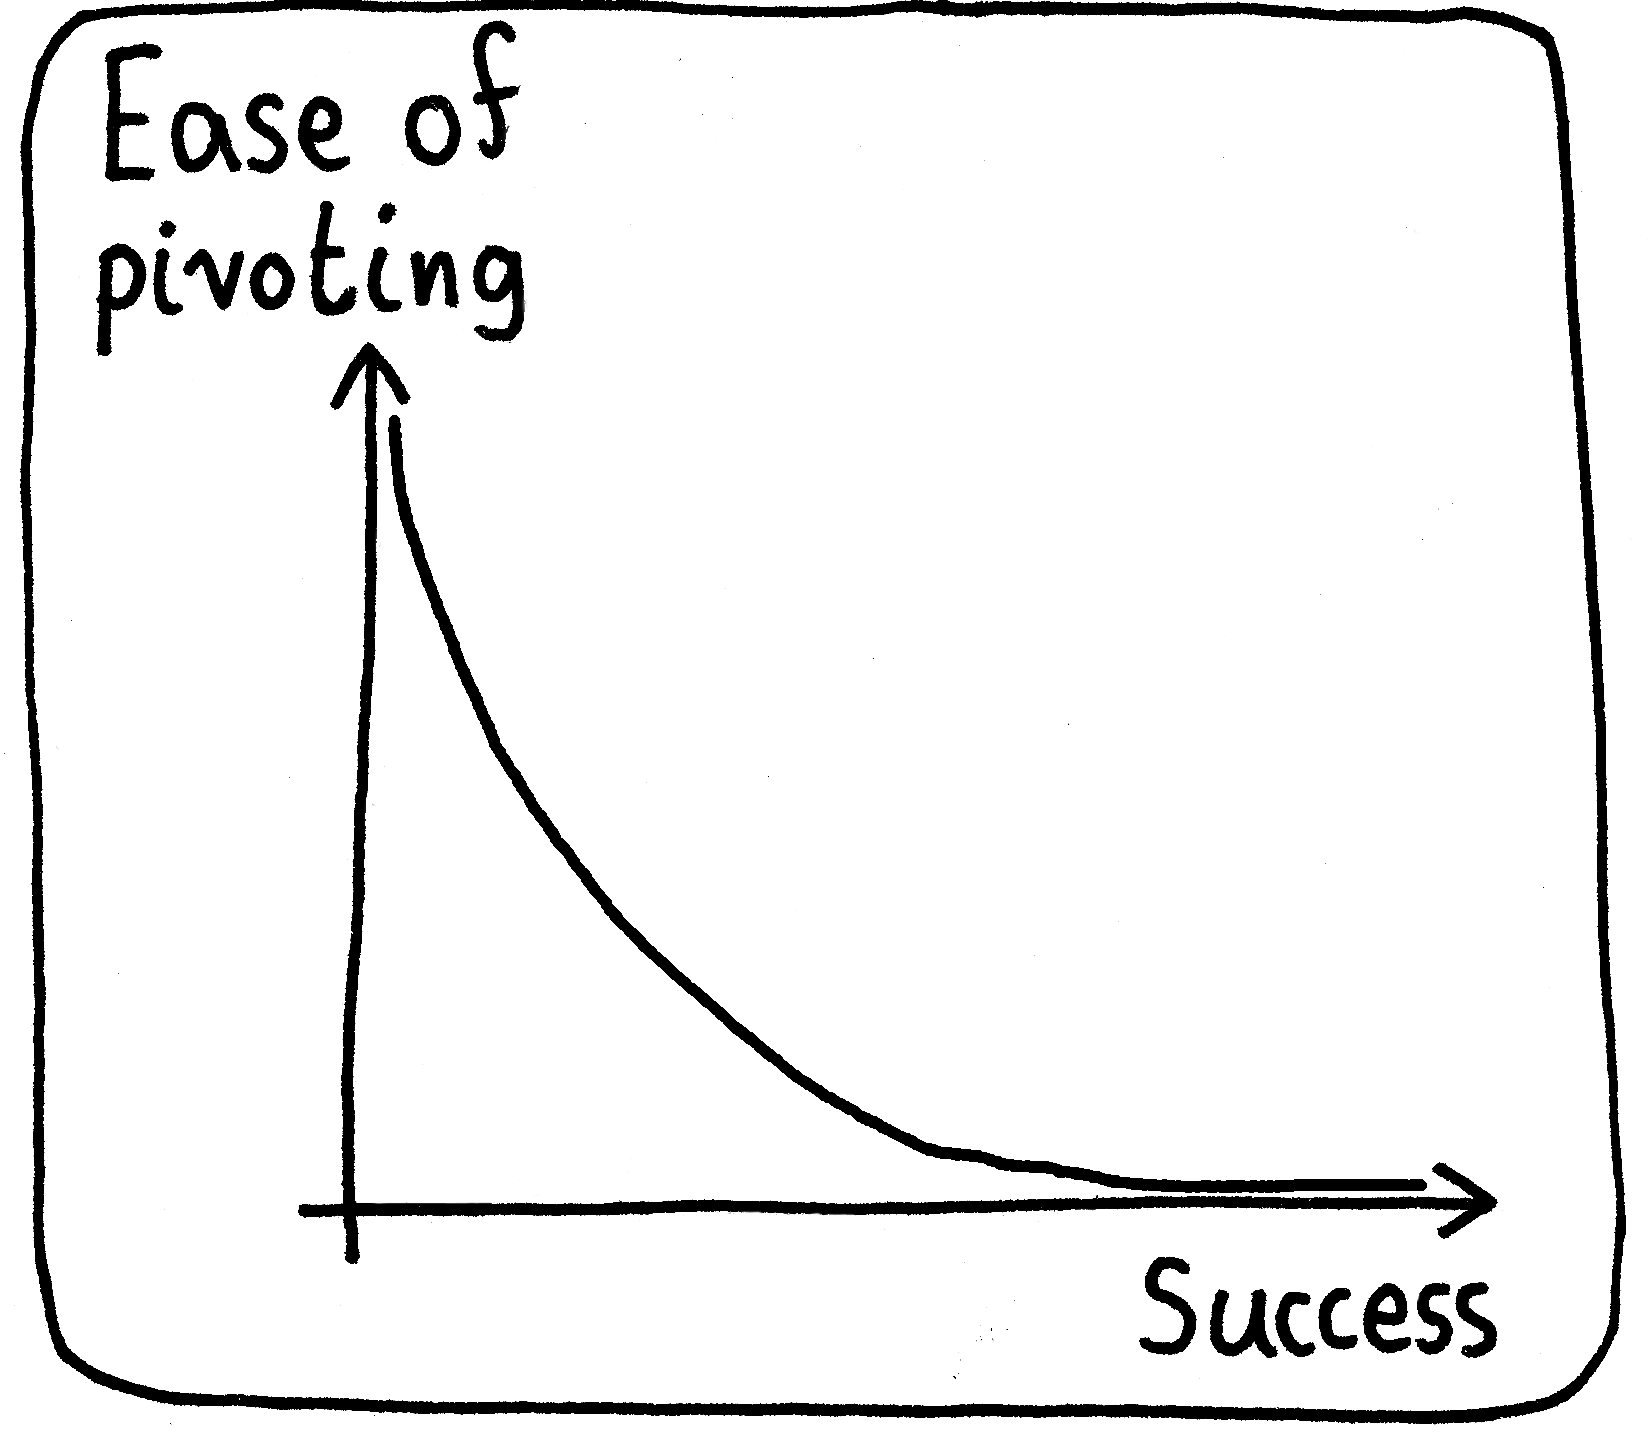
This is why it can be good to regularly reflect on if you’re doing the work you want to be doing.
11 Aug 2023
Work Acknowledgement

I try to remind myself that there are many ways to find joy in the work.
07 Aug 2023