Comics about mathematics, science, and the student life.
Learning Curves
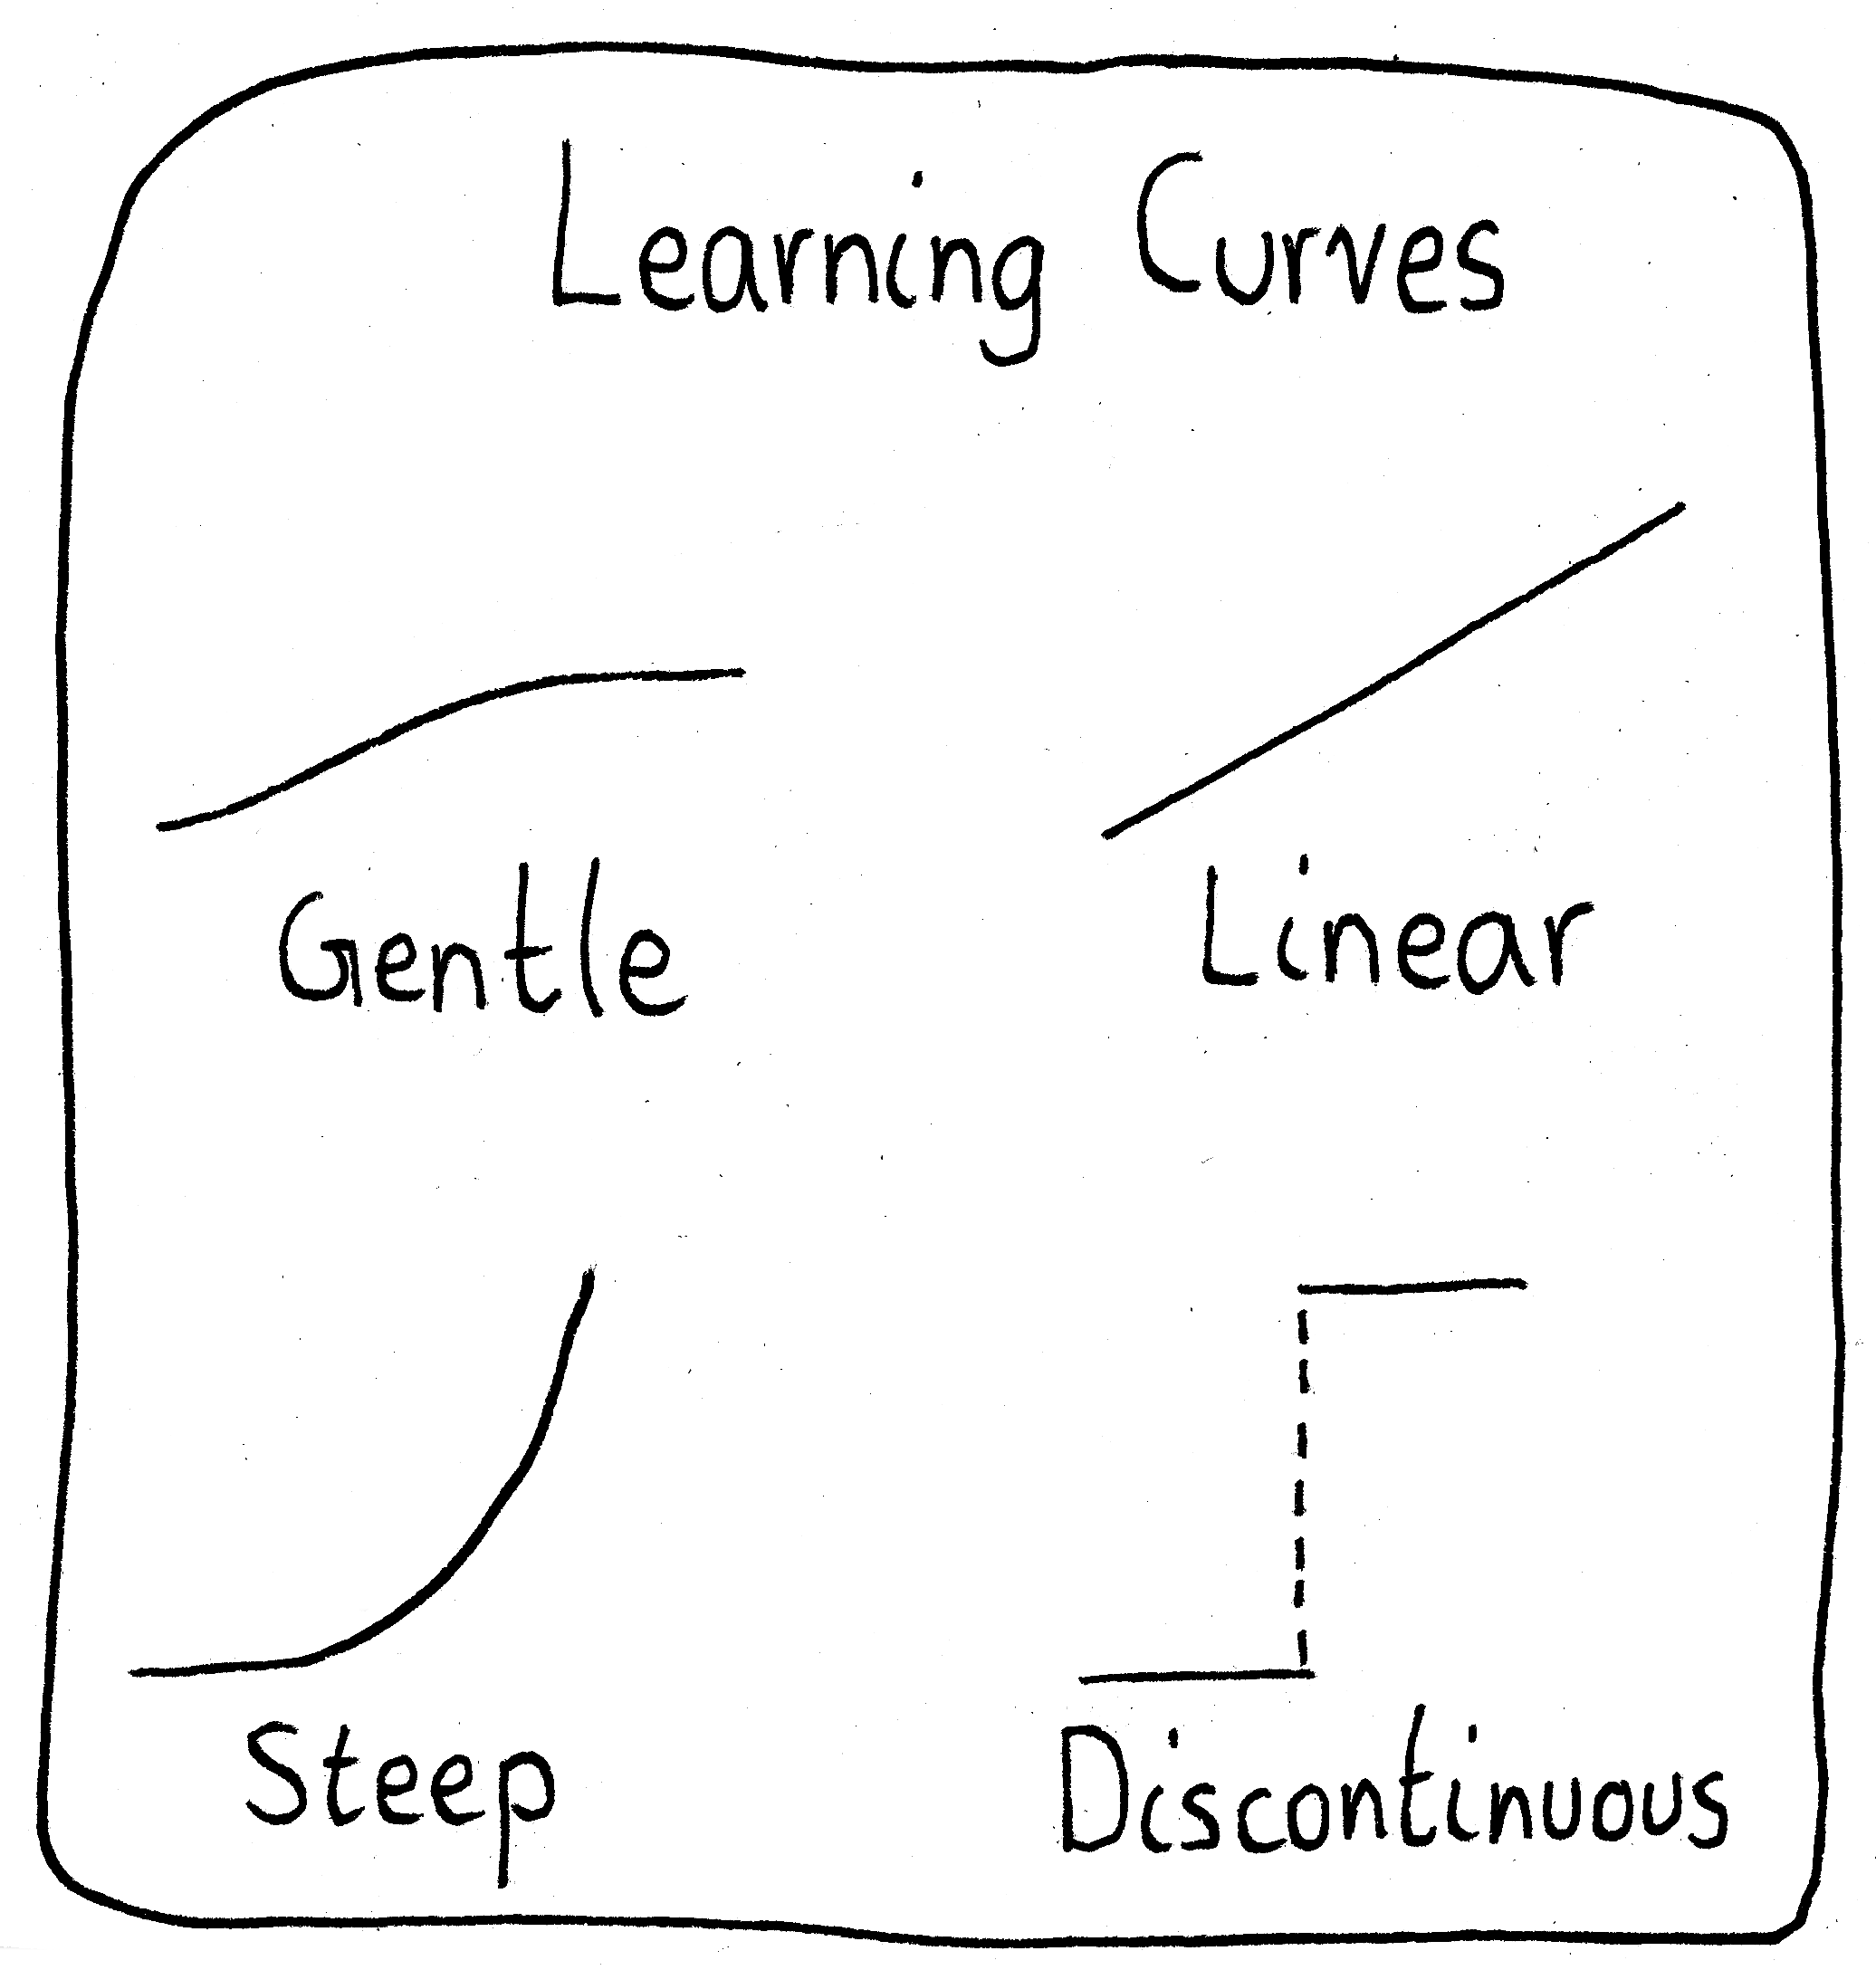
Not pictured: Non-monotonic, which is what I suspect most of us end up experiencing.
17 Aug 2022Questions and Confusion
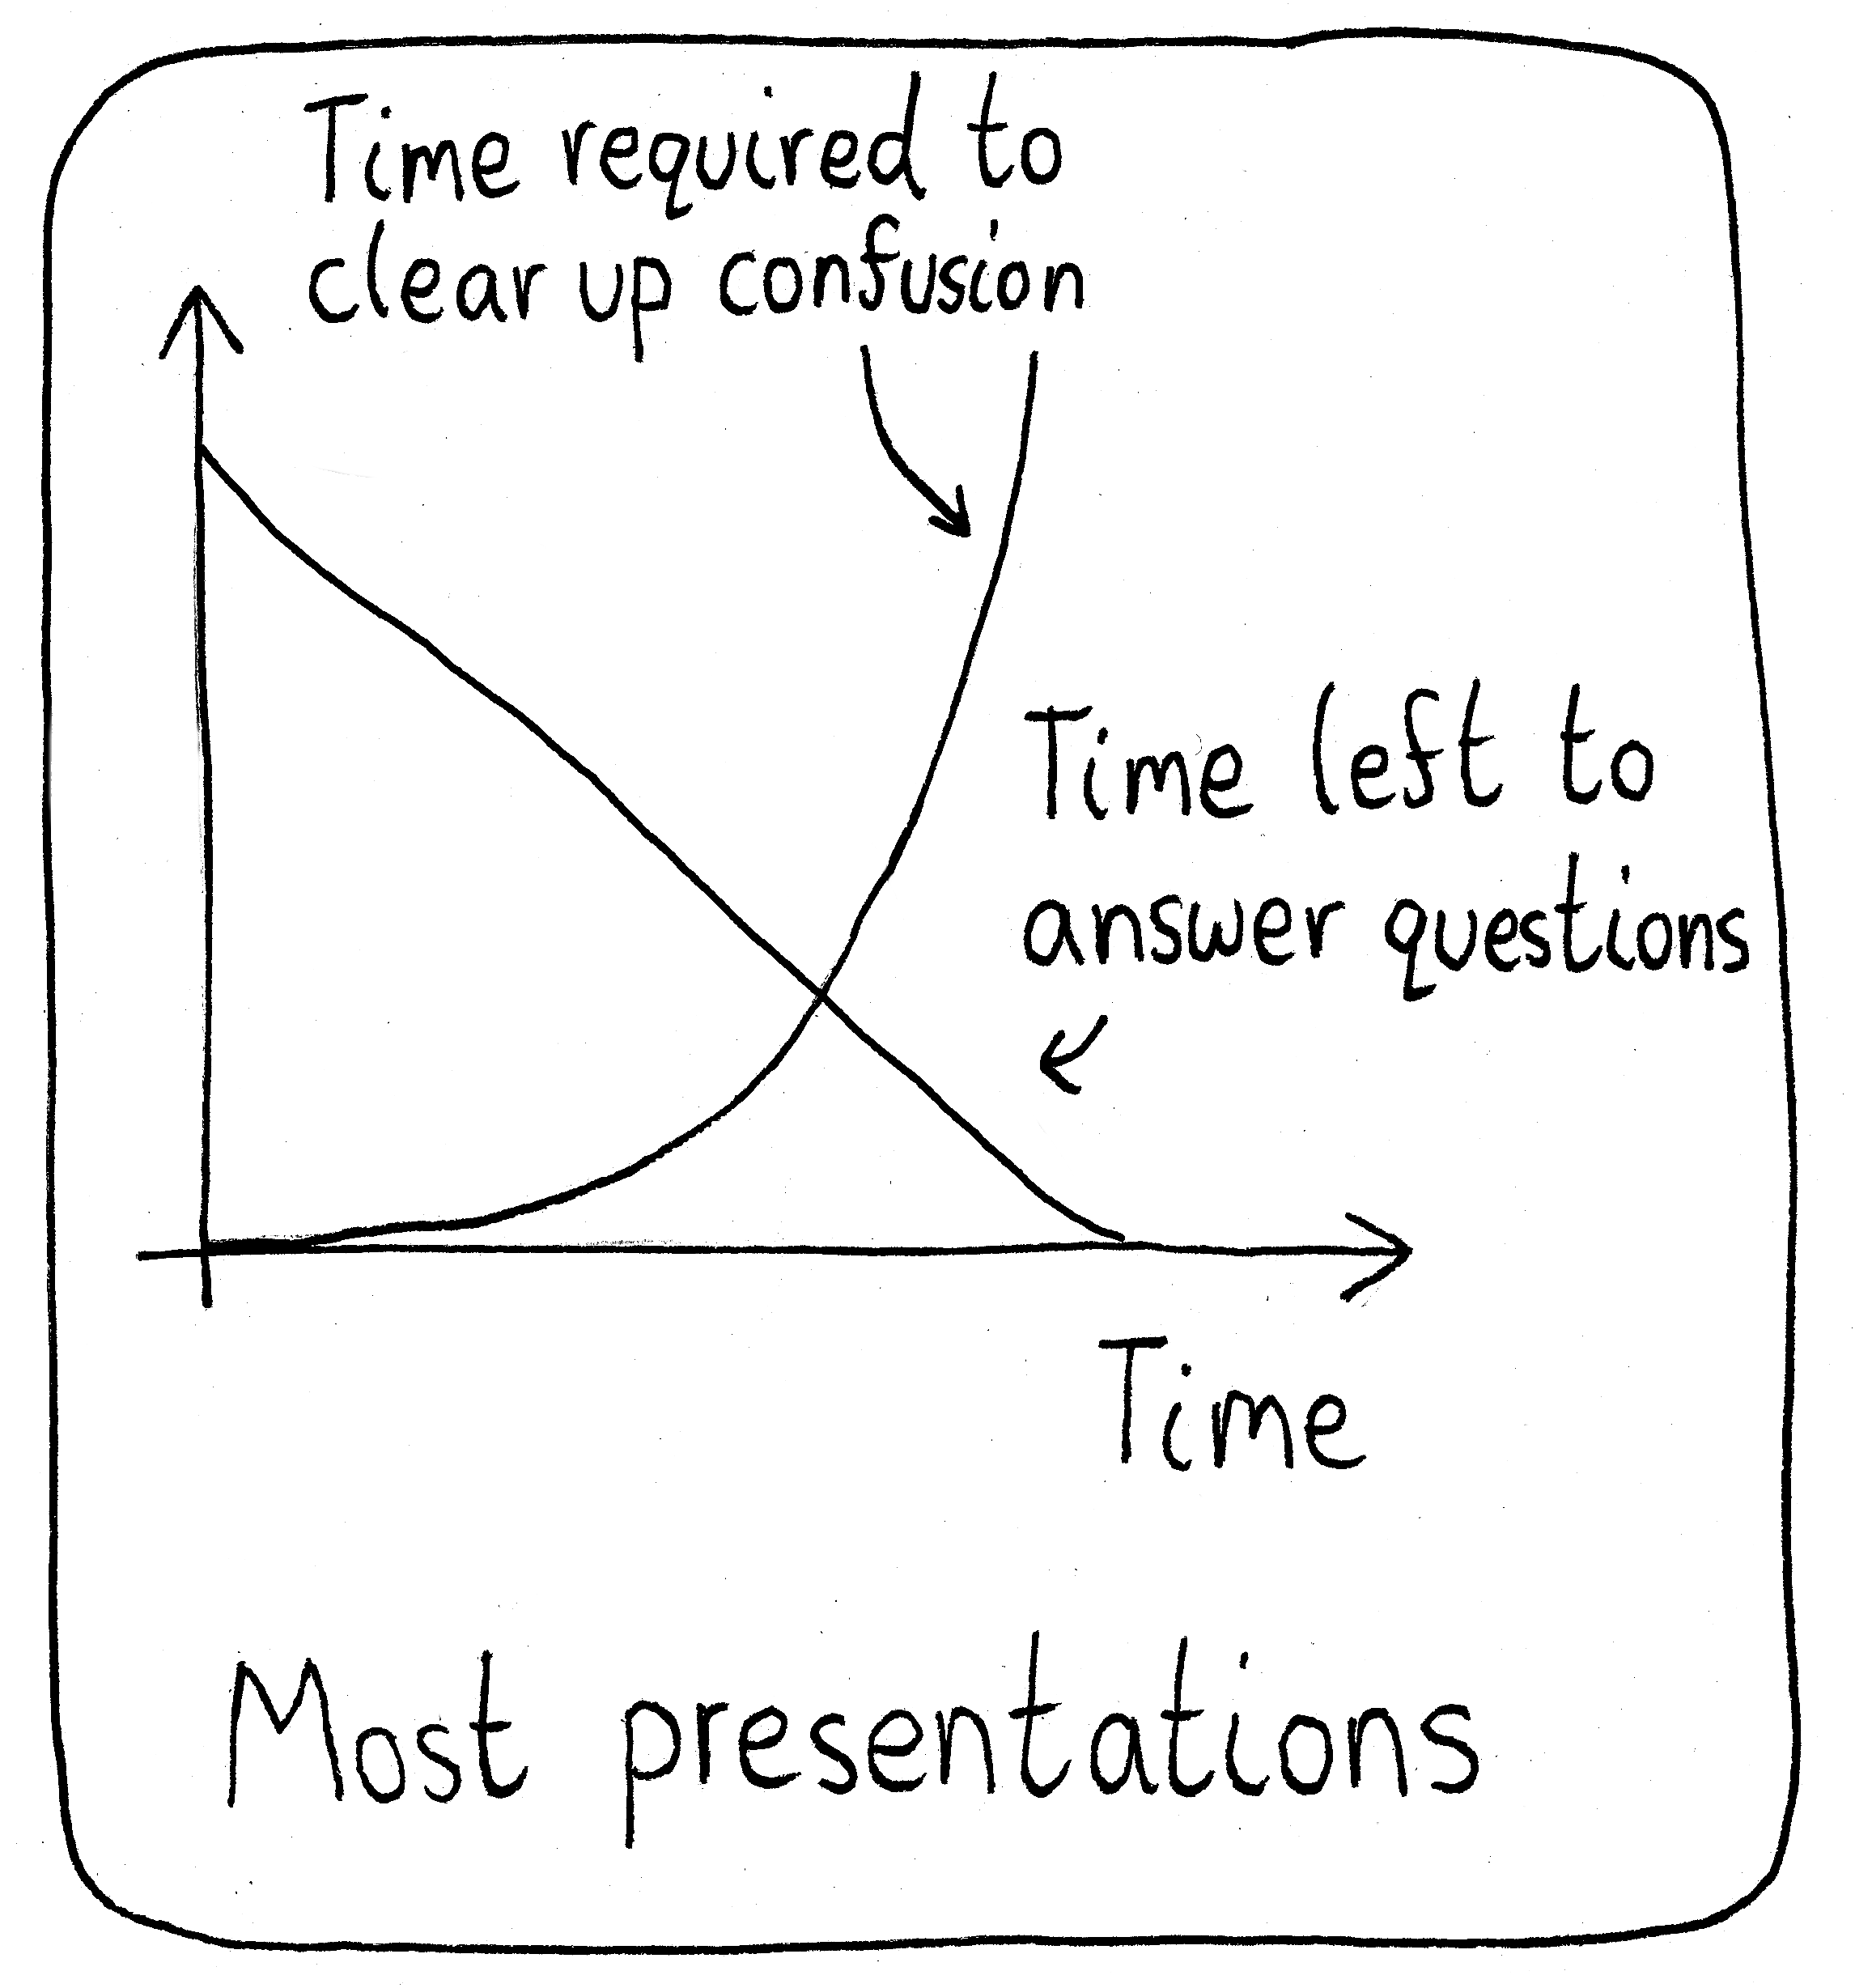
“We have time for two questions.” Pauses and checks the time. “Make that two quick questions.”
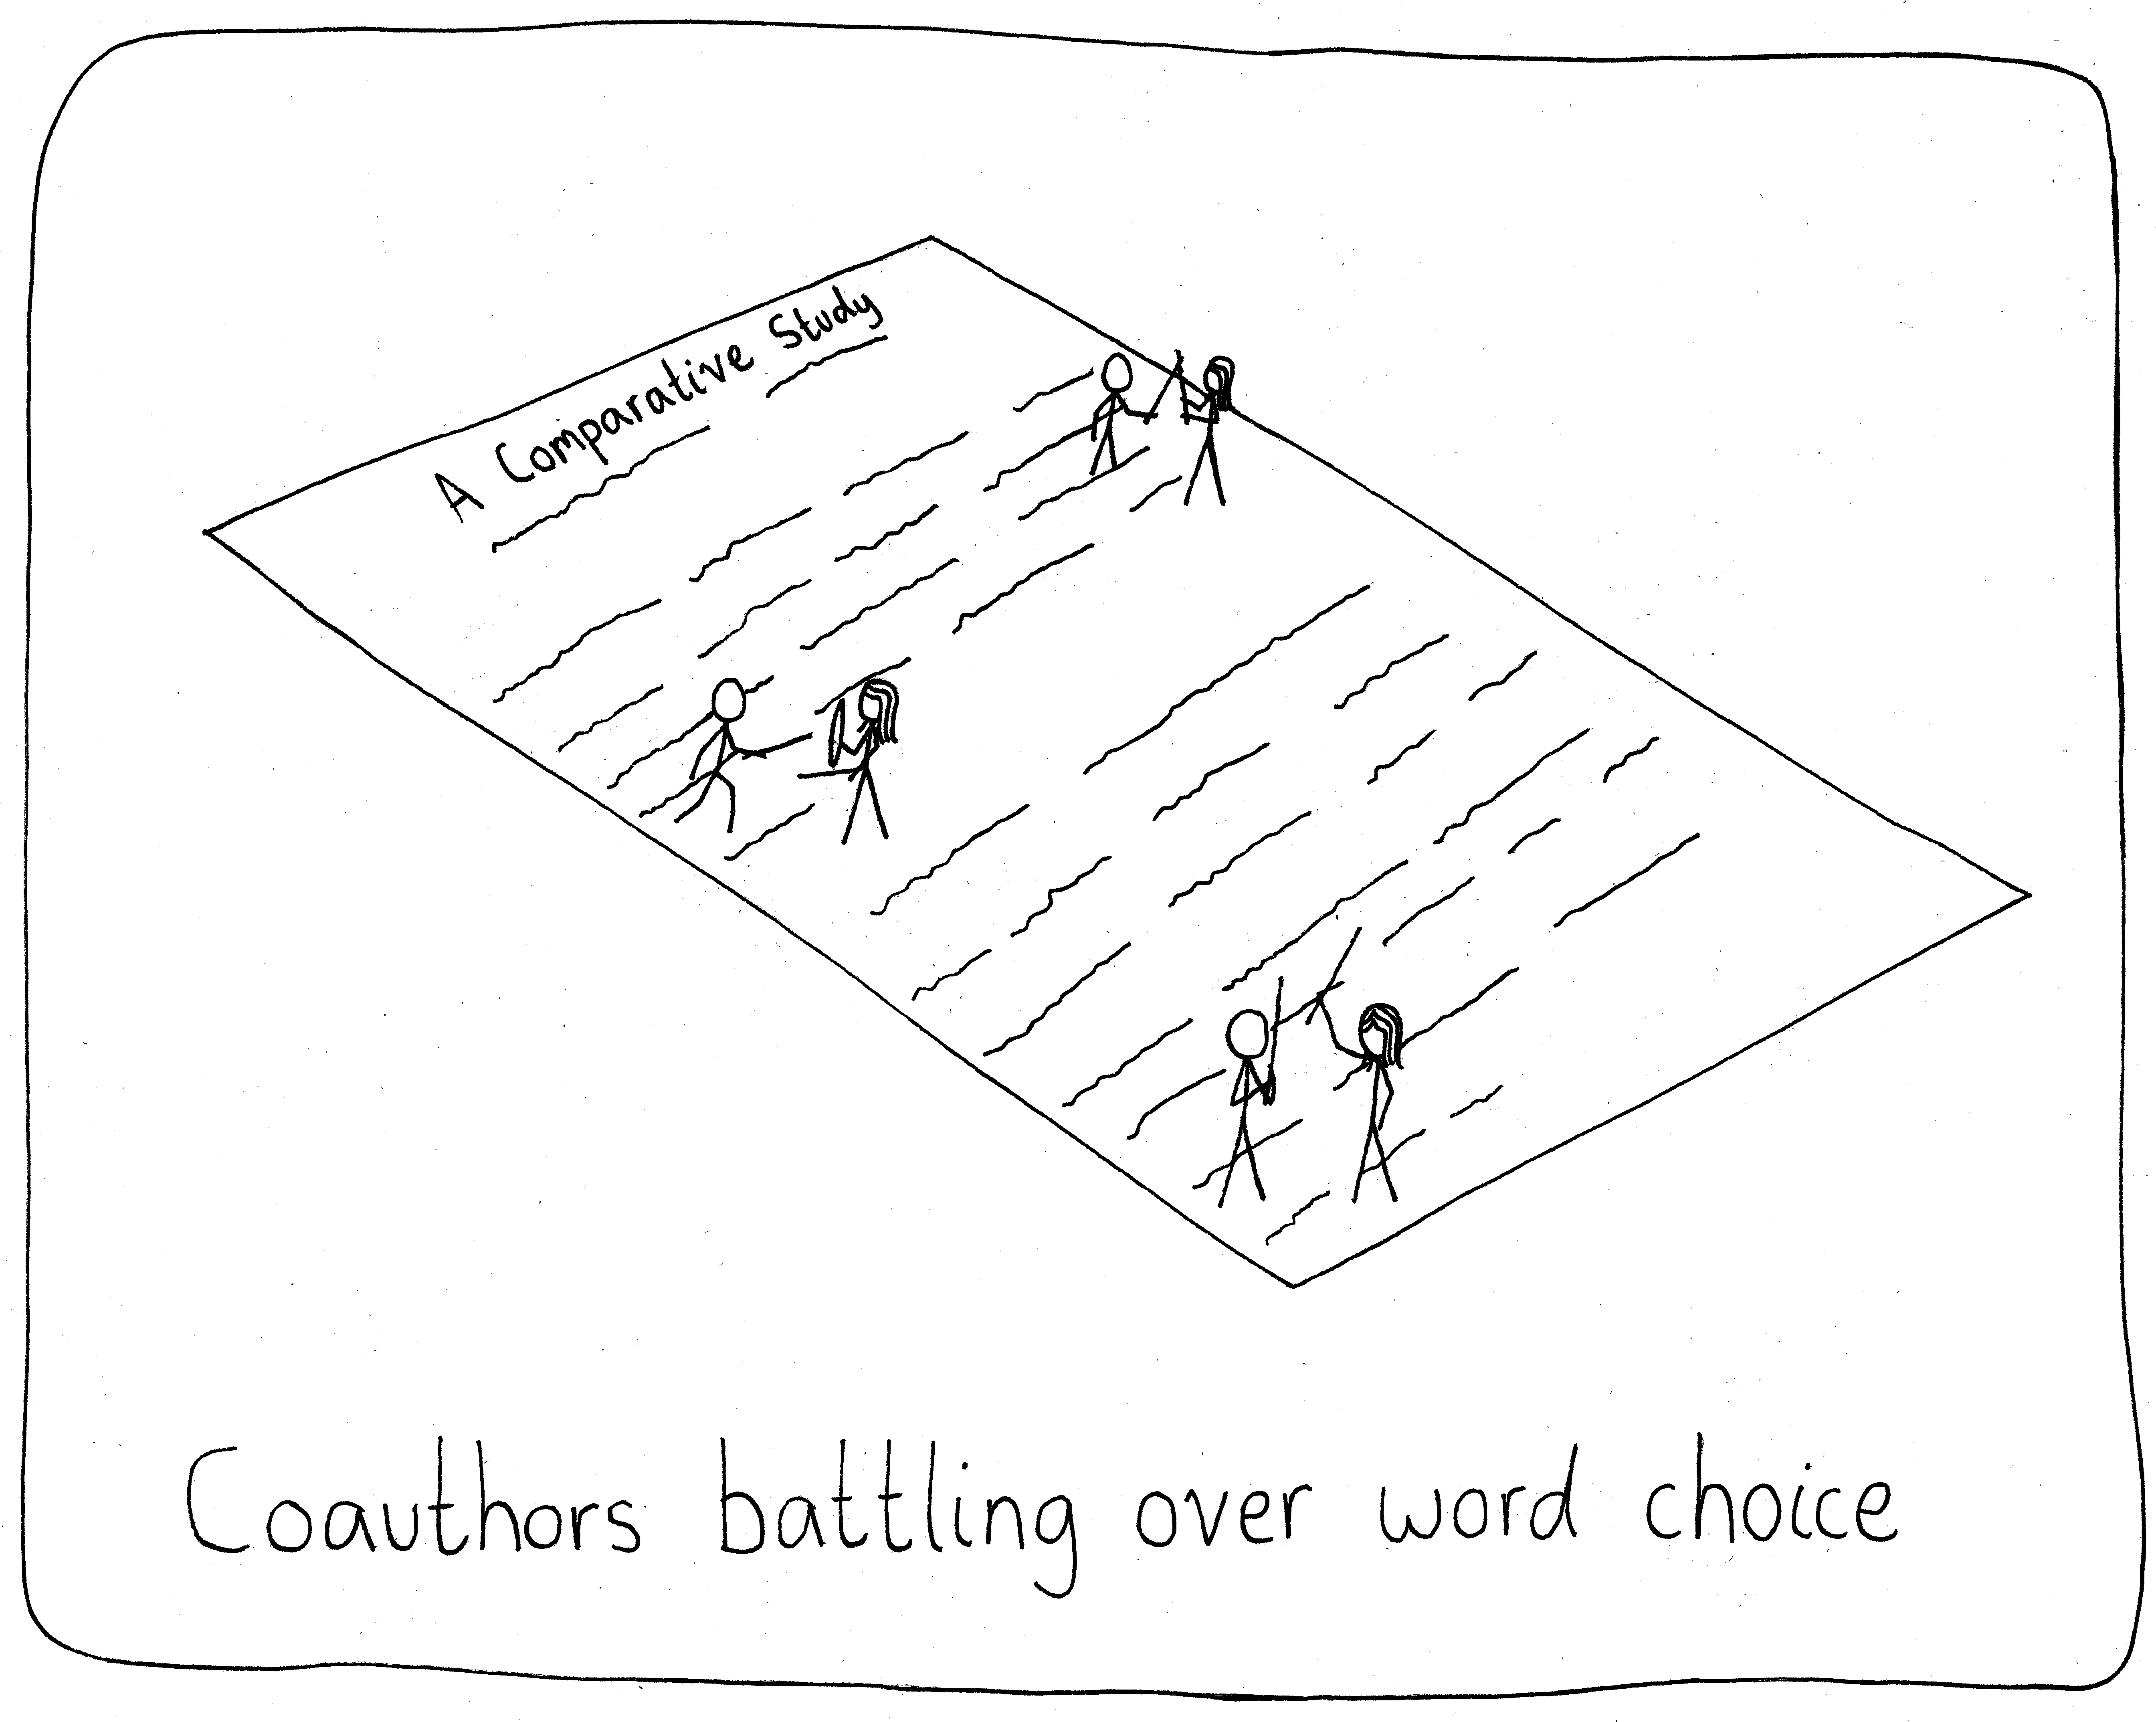
15 Aug 2022Time Management

“I also learned that research is super-duper hard. Maybe I should have realized that going in.”
12 Aug 2022

Professor Exposure
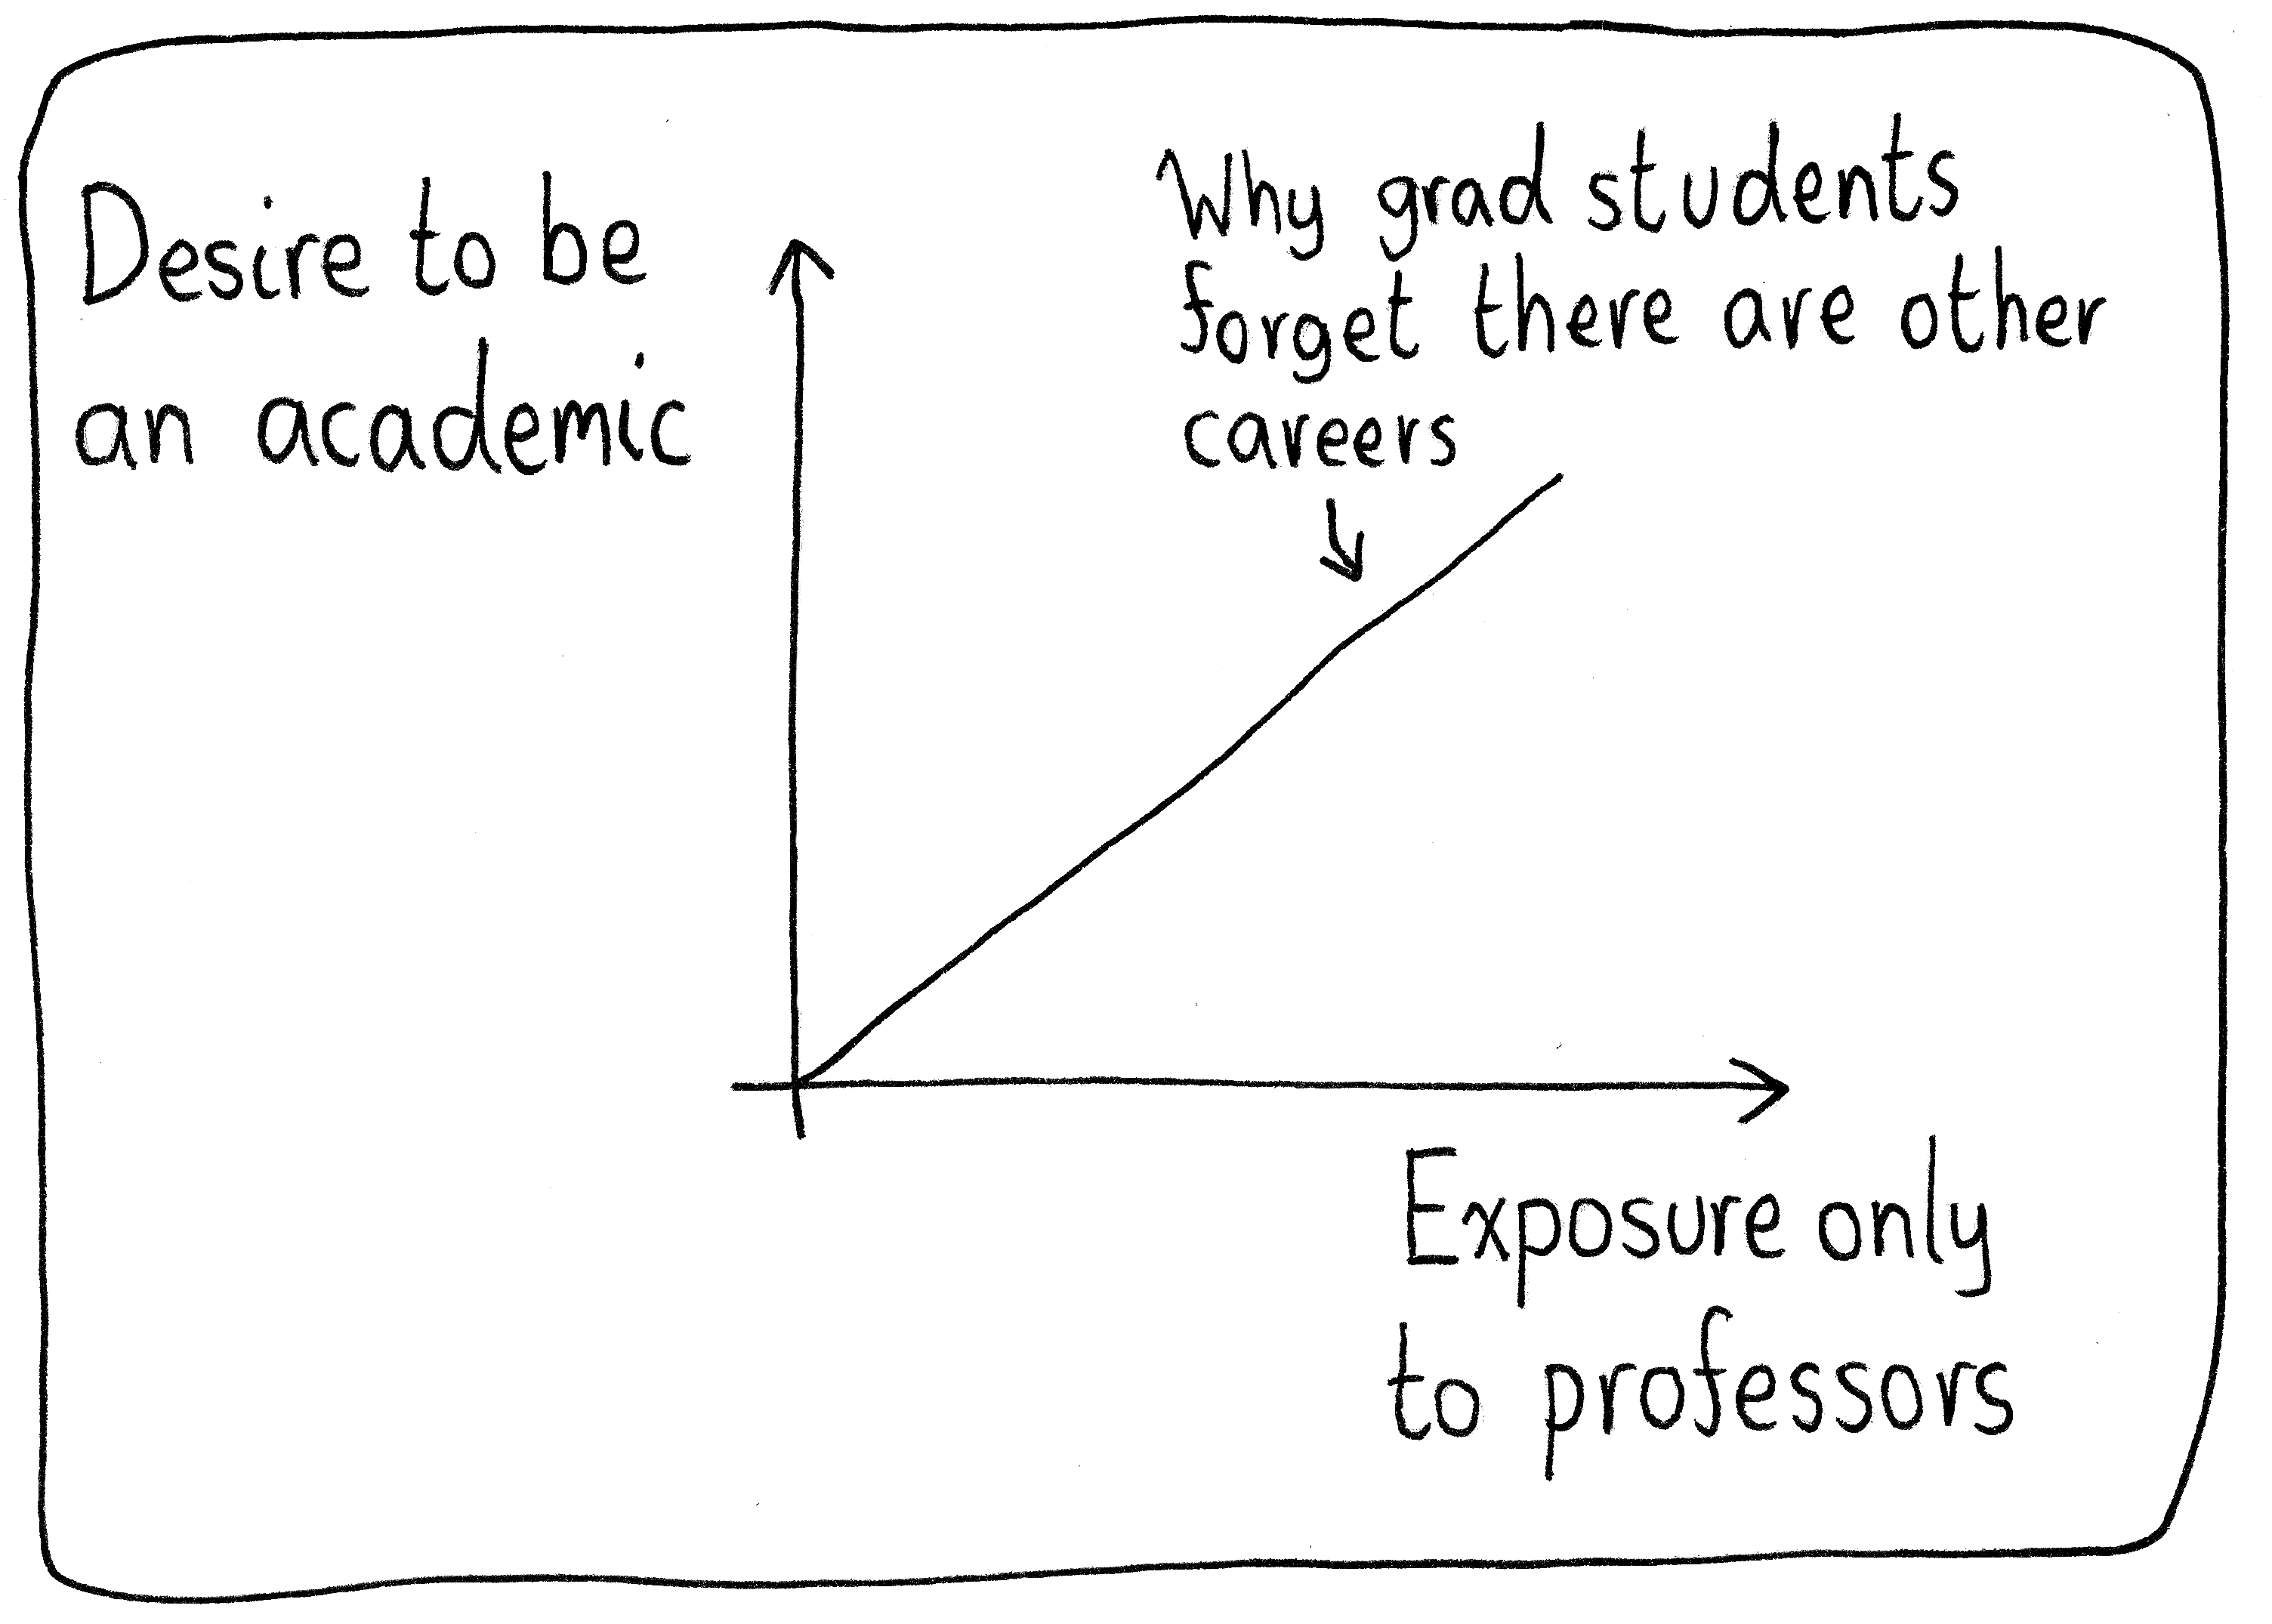
When I was young, nobody I knew was in academia, so I didn’t even know this was a possibility. It seems like I’ve hit the other extreme in higher education.
03 Aug 2022Bundle
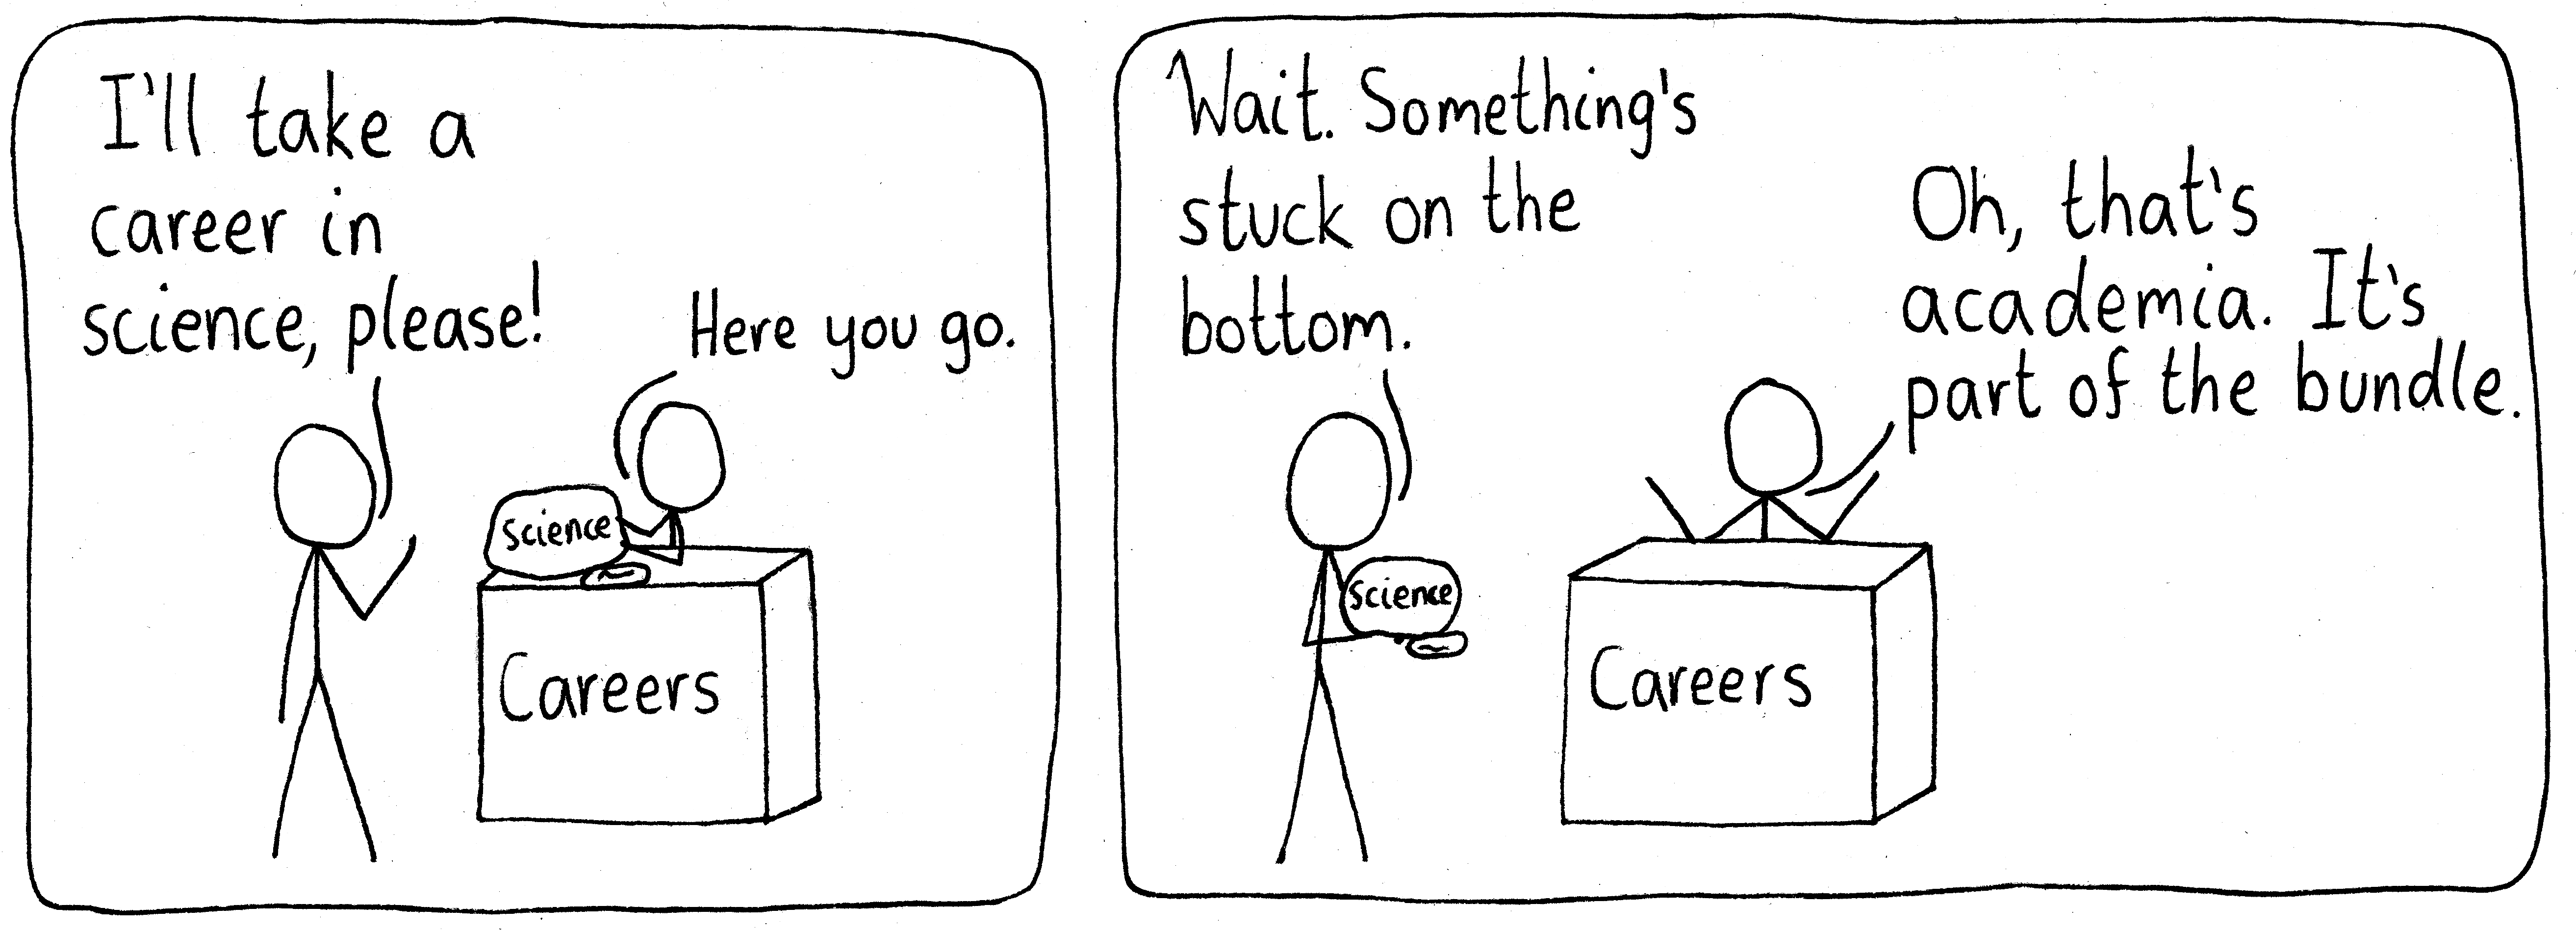
Like all bundles, there are advantages and disadvantages to this setup. And of course, there are science careers which aren’t in academia.
01 Aug 2022