 Comics about mathematics, science, and the student life.
Explanation Skills
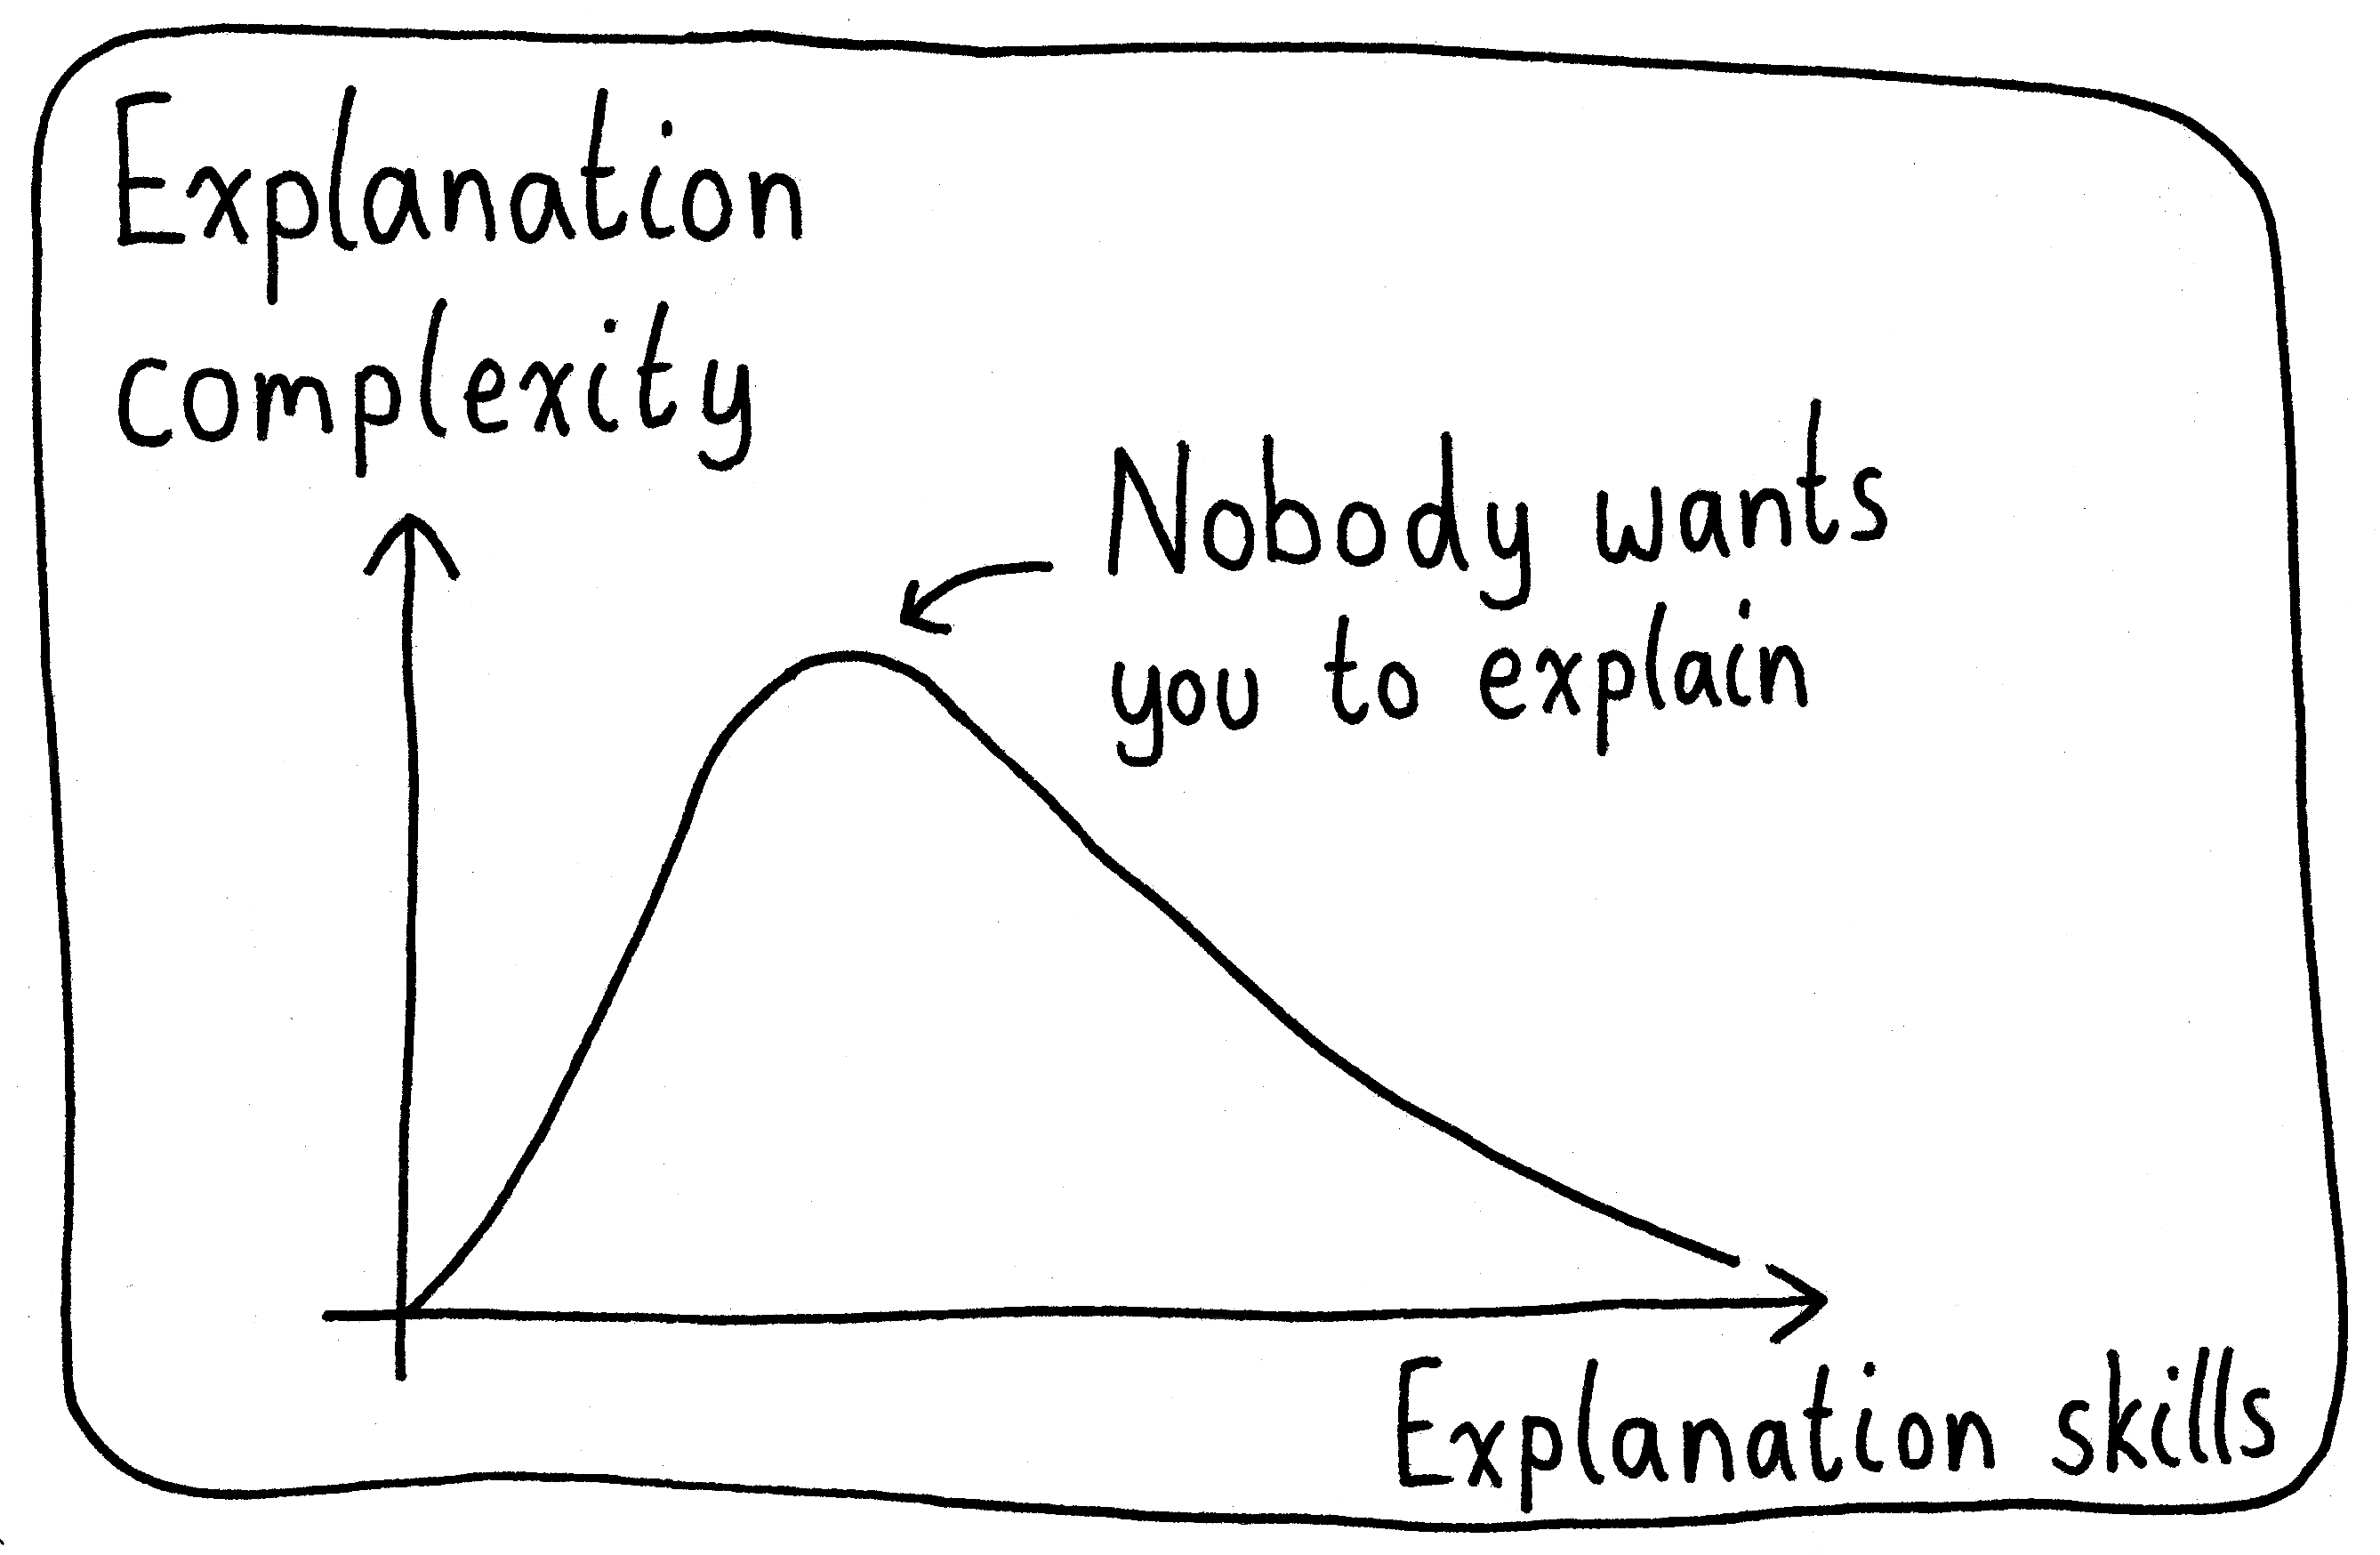
Have you ever started explaining something, only for the others in your discussion to quickly pivot away from the topic? If so, there’s a chance you were in that middle hump. (I’ve been there too.)
Published on May 12th, 2023 by Jeremy